

signal strength 2 of 5
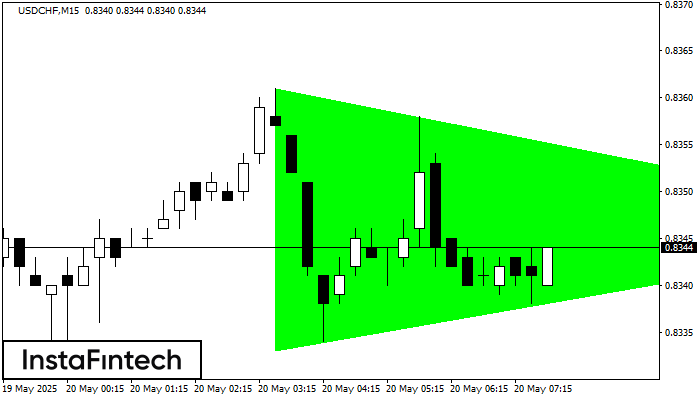
According to the chart of M15, USDCHF formed the Bullish Symmetrical Triangle pattern, which signals the trend will continue. Description. The upper border of the pattern touches the coordinates 0.8361/0.8346 whereas the lower border goes across 0.8333/0.8346. The pattern width is measured on the chart at 28 pips. If the Bullish Symmetrical Triangle pattern is in progress during the upward trend, this indicates the current trend will go on. In case 0.8346 is broken, the price could continue its move toward 0.8368.
The M5 and M15 time frames may have more false entry points.
আরও দেখুন
- All
- Double Top
- Flag
- Head and Shoulders
- Pennant
- Rectangle
- Triangle
- Triple top
- All
- #AAPL
- #AMZN
- #Bitcoin
- #EBAY
- #FB
- #GOOG
- #INTC
- #KO
- #MA
- #MCD
- #MSFT
- #NTDOY
- #PEP
- #TSLA
- #TWTR
- AUDCAD
- AUDCHF
- AUDJPY
- AUDUSD
- EURCAD
- EURCHF
- EURGBP
- EURJPY
- EURNZD
- EURRUB
- EURUSD
- GBPAUD
- GBPCHF
- GBPJPY
- GBPUSD
- GOLD
- NZDCAD
- NZDCHF
- NZDJPY
- NZDUSD
- SILVER
- USDCAD
- USDCHF
- USDJPY
- USDRUB
- All
- M5
- M15
- M30
- H1
- D1
- All
- Buy
- Sale
- All
- 1
- 2
- 3
- 4
- 5

Corak pembalikan Double Top telah dibentuk pada #Bitcoin M5. Ciri-ciri: sempadan atas %P0.000000; sempadan bawah 107140.52; sempadan bawah 106768.13; lebar corak adalah 38591 mata. Dagangan menjual adalah lebih baik untuk
Carta masa M5 dan M15 mungkin mempunyai lebih banyak titik kemasukan palsu.
Open chart in a new window
Berdasarkan carta M5, #Bitcoin membentuk corak Segi Tiga Simetri Menaik. Sempadan yang lebih rendah bagi corak yang menyentuh koordinat 106253.43/106928.98 di mana sempadan atas merentasi 107645.53/106928.98. Sekiranya corak Segi Tiga
Carta masa M5 dan M15 mungkin mempunyai lebih banyak titik kemasukan palsu.
Open chart in a new window
Corak Double Bottom telah dibentuk pada AUDCHF M30. Pembentukan ini menandakan pembalikan aliran dari aliran menurun ke atas. Isyarat ialah perdagangan membeli harus dibuka selepas sempadan atas corak 0.5226 telah
Open chart in a new window


