


signal strength 2 of 5
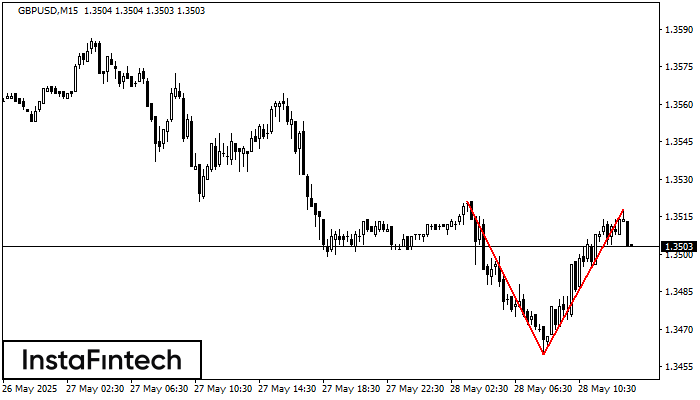
On the chart of GBPUSD M15 the Double Top reversal pattern has been formed. Characteristics: the upper boundary 1.3518; the lower boundary 1.3460; the width of the pattern 58 points. The signal: a break of the lower boundary will cause continuation of the downward trend targeting the 1.3438 level.
The M5 and M15 time frames may have more false entry points.
- All
- Double Top
- Flag
- Head and Shoulders
- Pennant
- Rectangle
- Triangle
- Triple top
- All
- #AAPL
- #AMZN
- #Bitcoin
- #EBAY
- #FB
- #GOOG
- #INTC
- #KO
- #MA
- #MCD
- #MSFT
- #NTDOY
- #PEP
- #TSLA
- #TWTR
- AUDCAD
- AUDCHF
- AUDJPY
- AUDUSD
- EURCAD
- EURCHF
- EURGBP
- EURJPY
- EURNZD
- EURRUB
- EURUSD
- GBPAUD
- GBPCHF
- GBPJPY
- GBPUSD
- GOLD
- NZDCAD
- NZDCHF
- NZDJPY
- NZDUSD
- SILVER
- USDCAD
- USDCHF
- USDJPY
- USDRUB
- All
- M5
- M15
- M30
- H1
- D1
- All
- Buy
- Sale
- All
- 1
- 2
- 3
- 4
- 5
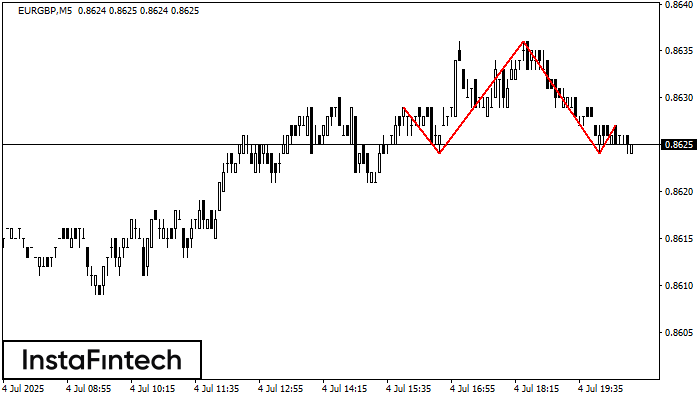
According to the chart of M5, EURGBP formed the Head and Shoulders pattern. The Head’s top is set at 0.8636 while the median line of the Neck is found
The M5 and M15 time frames may have more false entry points.
Open chart in a new window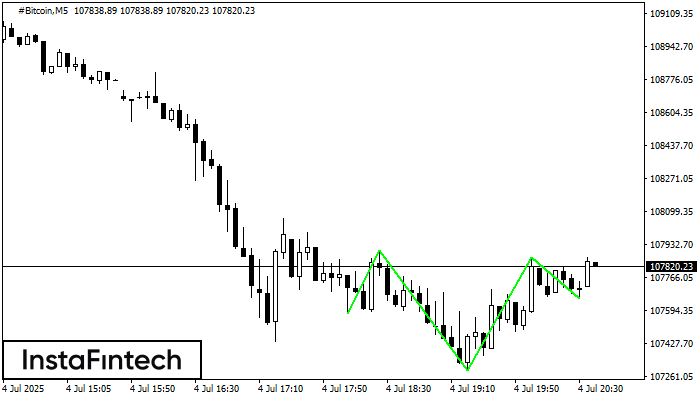
According to the chart of M5, #Bitcoin produced the pattern termed the Inverse Head and Shoulder. The Head is fixed at 107290.48 while the median line of the Neck
The M5 and M15 time frames may have more false entry points.
Open chart in a new window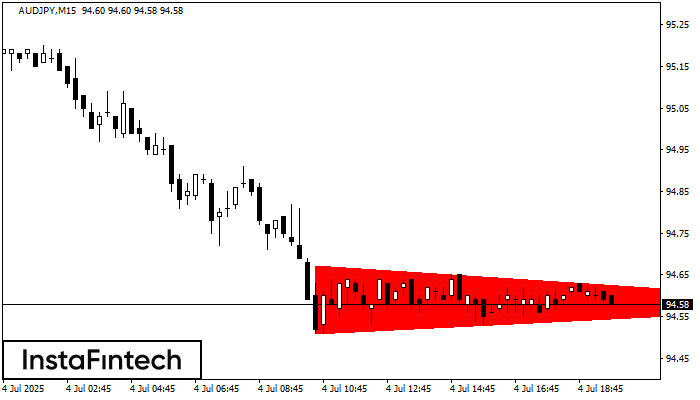
According to the chart of M15, AUDJPY formed the Bearish Symmetrical Triangle pattern. Trading recommendations: A breach of the lower border 94.51 is likely to encourage a continuation
The M5 and M15 time frames may have more false entry points.
Open chart in a new window


