signal strength 1 of 5

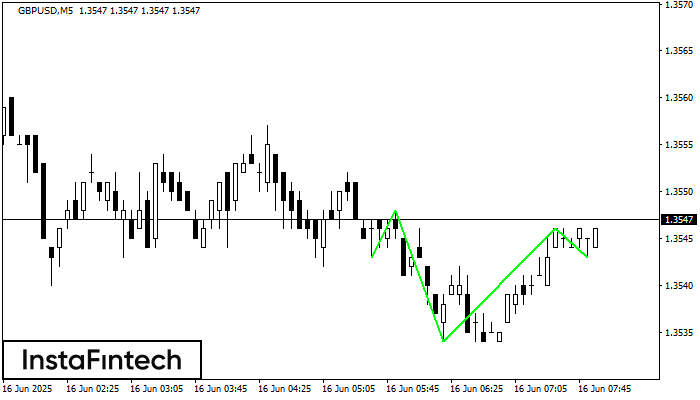
According to the chart of M5, GBPUSD produced the pattern termed the Inverse Head and Shoulder. The Head is fixed at 1.3534 while the median line of the Neck is set at 1.3548/1.3546. The formation of the Inverse Head and Shoulder Pattern clearly indicates a reversal of the downward trend. In means that in case the scenario comes true, the price of GBPUSD will go towards 1.3561.
The M5 and M15 time frames may have more false entry points.
See Also
- All
- Double Top
- Flag
- Head and Shoulders
- Pennant
- Rectangle
- Triangle
- Triple top
- All
- #AAPL
- #AMZN
- #Bitcoin
- #EBAY
- #FB
- #GOOG
- #INTC
- #KO
- #MA
- #MCD
- #MSFT
- #NTDOY
- #PEP
- #TSLA
- #TWTR
- AUDCAD
- AUDCHF
- AUDJPY
- AUDUSD
- EURCAD
- EURCHF
- EURGBP
- EURJPY
- EURNZD
- EURRUB
- EURUSD
- GBPAUD
- GBPCHF
- GBPJPY
- GBPUSD
- GOLD
- NZDCAD
- NZDCHF
- NZDJPY
- NZDUSD
- SILVER
- USDCAD
- USDCHF
- USDJPY
- USDRUB
- All
- M5
- M15
- M30
- H1
- D1
- All
- Buy
- Sale
- All
- 1
- 2
- 3
- 4
- 5
According to the chart of M5, GBPCHF formed the Bearish Rectangle. The pattern indicates a trend continuation. The upper border is 1.0724, the lower border is 1.0709. The signal means
The M5 and M15 time frames may have more false entry points.
Open chart in a new windowAccording to the chart of M5, AUDUSD formed the Bearish Rectangle which is a pattern of a trend continuation. The pattern is contained within the following borders: lower border 0.6559
The M5 and M15 time frames may have more false entry points.
Open chart in a new windowOn the chart of EURGBP M15 the Double Top reversal pattern has been formed. Characteristics: the upper boundary 0.8725; the lower boundary 0.8715; the width of the pattern 10 points
The M5 and M15 time frames may have more false entry points.
Open chart in a new window