Rimani

I pattern sono modelli grafici che forma il prezzo nel grafico. Secondo uno dei postulati dell'analisi tecnica, la storia (movimento dei prezzi) si ripete. Ciò significa che i movimenti dei prezzi sono spesso simili nelle stesse situazioni, il che rende possibile prevedere con maggiore probabilità ulteriore sviluppo della situazione.
I pattern pertinenti di InstaForex è un servizio facile da usare che ti consente di conoscere gli ultimi cambiamenti del mercato e reagire agli eventi in tempo. Nel nostro servizio troverai sempre gli schemi più recenti e pertinenti su ogni coppia a qualunque ora.
was formed on 05.06 at 16:30:32 (UTC+0)
signal strength 4 of 5
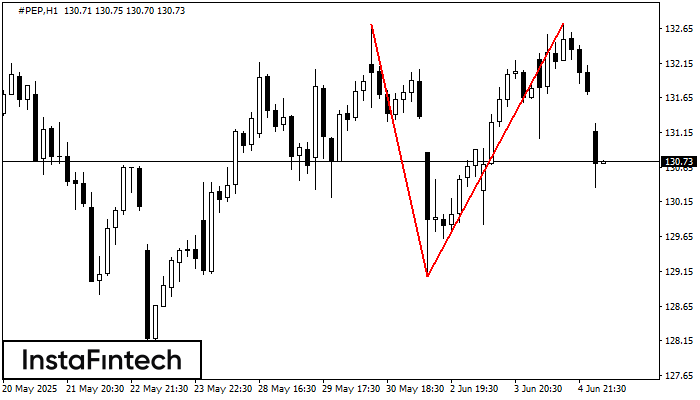
The Double Top reversal pattern has been formed on #PEP H1. Characteristics: the upper boundary 132.70; the lower boundary 129.07; the width of the pattern is 365 points. Sell trades are better to be opened below the lower boundary 129.07 with a possible movements towards the 128.67 level.
Guardate inoltre
- All
- Double Top
- Flag
- Head and Shoulders
- Pennant
- Rectangle
- Triangle
- Triple top
- All
- #AAPL
- #AMZN
- #EBAY
- #FB
- #GOOG
- #INTC
- #KO
- #MA
- #MCD
- #MSFT
- #NTDOY
- #PEP
- #TSLA
- #TWTR
- AUDCAD
- AUDCHF
- AUDJPY
- AUDUSD
- EURCAD
- EURCHF
- EURGBP
- EURJPY
- EURNZD
- EURRUB
- EURUSD
- GBPAUD
- GBPCHF
- GBPJPY
- GBPUSD
- GOLD
- NZDCAD
- NZDCHF
- NZDJPY
- NZDUSD
- SILVER
- USDCAD
- USDCHF
- USDJPY
- USDRUB
- All
- M5
- M15
- M30
- H1
- D1
- All
- Buy
- Sale
- All
- 1
- 2
- 3
- 4
- 5
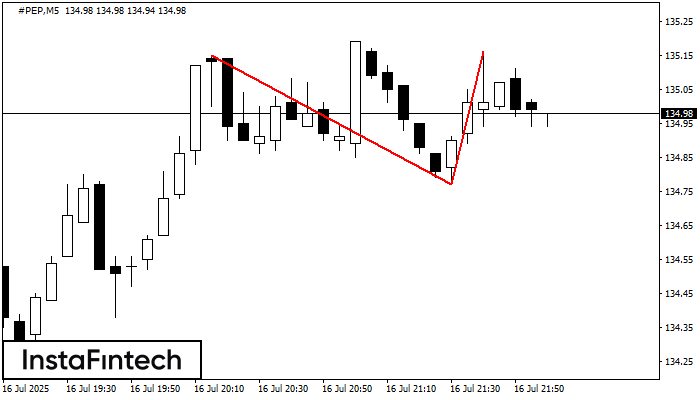
Il modello Doppio Massimo è stato formato su #PEP M5. Si segnala che il trend è stato cambiato dall'ascendente al discendente. Probabilmente, se la base del modello 134.77 è rotta
I time frame M5 e M15 possono avere più punti di ingresso falsi.
Open chart in a new window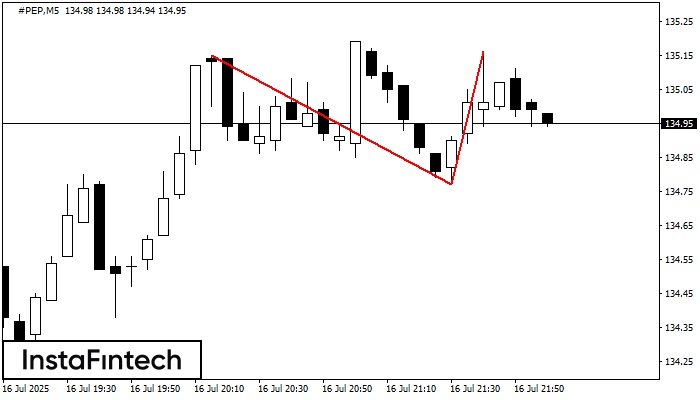
Il modello Doppio Massimo è stato formato su #PEP M5. Si segnala che il trend è stato cambiato dall'ascendente al discendente. Probabilmente, se la base del modello 134.77 è rotta
I time frame M5 e M15 possono avere più punti di ingresso falsi.
Open chart in a new window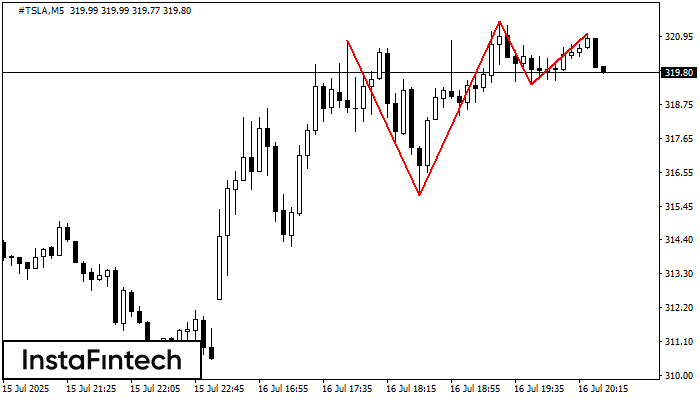
Il modello Triplo Massimo si è formato sul grafico del #TSLA M5. Caratteristiche del modello: i confini hanno un angolo ascendente; la linea inferiore del modello ha le coordinate 315.83/319.41
I time frame M5 e M15 possono avere più punti di ingresso falsi.
Open chart in a new window