empty
11.03.2025 09:39 AM
BTC/USD Analysis – March 11th: Has Bitcoin's Decline Ended?

This image is no longer relevant

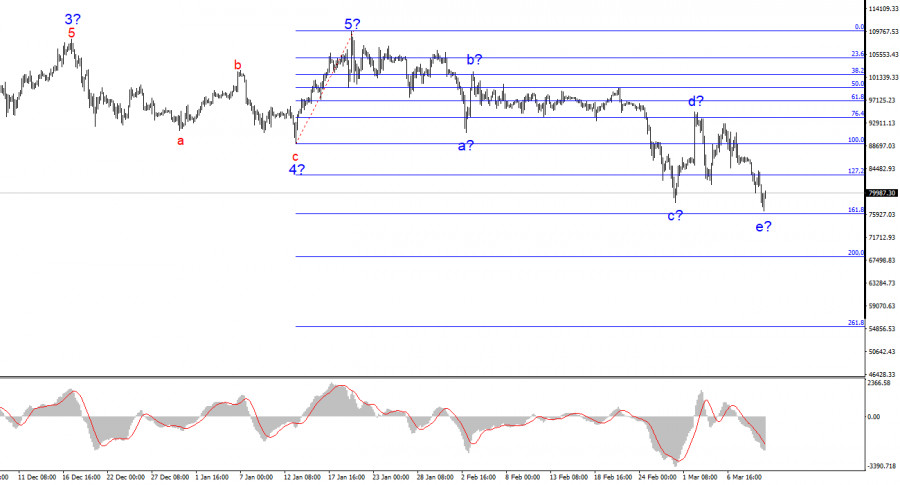
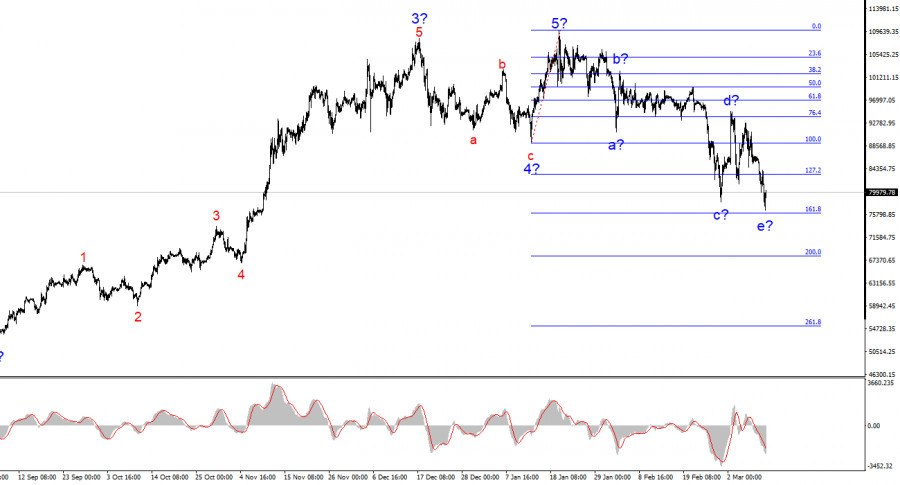
The wave structure on the 4-hour BTC/USD chart is quite clear. Following the completion of a five-wave bullish trend, the market has entered a downward phase, which currently appears to be a corrective wave. Based on this, I did not and do not expect Bitcoin to rise above $110,000 – $115,000 in the coming months.

The news cycle previously supported Bitcoin's growth, fueled by continuous institutional investments, participation from government entities and pension funds. However, Trump's policies have driven investors out of the market, and a trend cannot remain bullish indefinitely. The wave that began on January 20 does not resemble an impulse wave, indicating a complex corrective structure that could last for months. The internal structure of this first wave is complicated and ambiguous. It is crucial to remember that wave analysis should be as simple and clear as possible for effective trading.

Over the past five days, BTC/USD has fallen by $12,000. While this may seem significant, a $2,500 daily drop is not particularly extreme for Bitcoin. However, Bitcoin has been declining for two months, coinciding remarkably with Donald Trump's return to power in the U.S. While it is unrealistic to expect Bitcoin to keep falling for the next four years, market participants lack optimism regarding the "global cryptocurrency capital" narrative.

Trump may talk about creating a National Cryptocurrency Reserve, loosening regulations, and supporting the crypto sector, but the market needs concrete actions and real improvements. Moreover, even if these positive changes occur, the trend cannot always be bullish.

Currently, the latest downward wave has taken a five-wave structure, suggesting that it may be near completion, or could end around the $76,000 level, which corresponds to 161.8% Fibonacci retracement. If this assumption holds true, a new set of bullish waves (or a single corrective wave) could begin from current levels. I assume that the price action from January 20 until now represents a global "A" wave of a larger trend segment. This means that Bitcoin's decline is not over yet, but it may pause before resuming later.

This image is no longer relevant

Key Takeaways

Based on my BTC/USD analysis, I conclude that the current bullish phase has ended. The market is now entering a complex, multi-month correction. I have previously advised against buying Bitcoin, and I continue to discourage long positions. A decline below the low of Wave 4 signals the formation of a broader downtrend, which is likely corrective in nature.

Thus, the best approach remains to look for selling opportunities. Bitcoin could fall to $76,000 (161.8% Fibonacci) and possibly $68,000 (200% Fibonacci) in the coming weeks. However, a short-term corrective rebound is also possible, providing new opportunities to short Bitcoin.

On higher timeframes, Bitcoin has completed a five-wave bullish cycle, and we are now witnessing the formation of either a corrective bearish phase or a fully-fledged downward trend.

Core Principles of My Analysis

  1. Wave structures should be simple and clear. Complicated structures are difficult to trade and often require adjustments.
  2. If there is uncertainty in the market, it is better to stay out.
  3. No market direction is ever 100% certain. Always use Stop Loss orders for risk management.
  4. Wave analysis should be complemented with other analytical methods and trading strategies.
Chin Zhao,
انسٹافاریکس کا تجزیاتی ماہر
© 2007-2025
ٹائم فریم منتخب کریں
5
منٹ
15
منٹ
30
منٹ
1
گھنٹہ
4
گھنٹے
1
دن
1
ہفتہ
انسٹافاریکس کے ساتھ کرپٹو کرنسی کی معاملاتی تبدیلیوں سے کمائیں۔
میٹا ٹریڈر 4 ڈاؤن لوڈ کریں اور اپنی پہلی ٹریڈ کھولیں۔
  • Grand Choice
    Contest by
    InstaForex
    InstaForex always strives to help you
    fulfill your biggest dreams.
    مقابلہ میں شامل ہوں

تجویز کردہ مضامین

جون 26 کو کرپٹو کرنسی مارکیٹ کے لیے تجارتی سفارشات

بٹ کوائن اور ایتھریم اس سال فیڈرل ریزرو سے متوقع شرح سود میں کٹوتیوں کی تعداد کے حوالے سے نئی پیشین گوئیوں کے درمیان مستحکم ترقی کا مظاہرہ

Miroslaw Bawulski 18:52 2025-06-26 UTC+2

جون 25 کو کرپٹو کرنسی مارکیٹ کے لیے تجارتی سفارشات

بٹ کوائن اور ایتھریم نے کل بھی اپنی ریلی جاری رکھی، جو ایران اور اسرائیل کے درمیان جنگ بندی کی خبروں سے شروع ہوئی۔ ایوان نمائندگان میں اپنی گواہی

Miroslaw Bawulski 16:30 2025-06-25 UTC+2

بی ٹی سی / یو ایس ڈی کا تجزیہ برائے 25 جون 2025

چارگھنٹے کے بی ٹی سی / یو ایس ڈی چارٹ پر لہر کا نمونہ عام طور پر واضح رہتا ہے۔ ہم نے ایک اصلاحی نیچے کی تشکیل کا مشاہدہ

Chin Zhao 16:26 2025-06-25 UTC+2

بٹ کوائن مسلسل اضآفہ کر رہا ہے

کل، بٹ کوائن نے اپنی اوپر کی حرکت جاری رکھی، جو کہ شرح سود کے مستقبل کے حوالے سے فیڈرل ریزرو کے چیئر جیروم پاول کے خاصے نرم لہجے

Jakub Novak 16:14 2025-06-25 UTC+2

جون 24 کو کرپٹو کرنسی مارکیٹ کے لیے تجارتی سفارشات

بٹ کوائن اور ایتھریم میں اس وقت تیزی سے اضافہ ہوا جب یہ خبریں سامنے آئیں کہ ایران اور اسرائیل اپنے حملوں کے تبادلے کو روک سکتے ہیں۔ امریکی

Miroslaw Bawulski 17:22 2025-06-24 UTC+2

بٹ کوائن اور ایتھریم دوبارہ مضبوط ہوئے ہیں

بٹ کوائن اور ایتھریم مضبوط کارکردگی دکھا رہے ہیں۔ $100,000 کی سطح کو پکڑنے کے بعد، بڑے خریدار اپنی معمول کی سرگرمی میں واپس آگئے اور پہلے

Jakub Novak 17:04 2025-06-24 UTC+2

جون 23 جون کو کرپٹو کرنسی مارکیٹ کے لیے تجارتی سفارشات

بٹ کوائن اور ایتھریم اس قیاس کے بعد گر گئے کہ ایران آبنائے ہرمز کو روک سکتا ہے اور امریکی حملوں کے جواب میں امریکی آئل ٹینکروں پر بمباری شروع

Miroslaw Bawulski 14:43 2025-06-23 UTC+2

مئی 20 کو کرپٹو مارکیٹ کے لیے تجارتی تجاویز (شمالی امریکی سیشن)

بٹ کوائن اور ایتھریم نے کل کی بیئر مارکیٹ میں وقفے کے بعد خریداری کے معاملے میں آج اچھی کارکردگی کا مظاہرہ کیا۔ کرپٹو کرنسی مارکیٹ میں ڈیمانڈ واپس آگئی

Miroslaw Bawulski 19:06 2025-06-20 UTC+2

جون 18 کو بی ٹی سی / یو ایس ڈی میں ویوو کا تجزیہ۔ بٹ کوائن اپنے مجموعی جذبے کو صاف کرنے کے لیے

حالیہ مہینوں میں بی ٹی سی / یو ایس ڈی کے 4 گھنٹے کے چارٹ پر لہر کا انداز زیادہ پیچیدہ ہو گیا ہے۔ ہم نے نیچے

Chin Zhao 19:34 2025-06-18 UTC+2

جون 18 کو کرپٹو کرنسی مارکیٹ کے لیے تجارتی سفارشات

بٹ کوائن اور ایتھریم مشرق وسطیٰ میں تازہ ترین کشیدگی کے بعد ڈوب گئے اور اس بات کے بڑھتے ہوئے امکانات کہ ریاست ہائے متحدہ امریکہ کے تنازع میں آجائے

Miroslaw Bawulski 15:24 2025-06-18 UTC+2
ابھی فوری بات نہیں کرسکتے ؟
اپنا سوال پوچھیں بذریعہ چیٹ.
Widget callback
 

Dear visitor,

Your IP address shows that you are currently located in the USA. If you are a resident of the United States, you are prohibited from using the services of InstaFintech Group including online trading, online transfers, deposit/withdrawal of funds, etc.

If you think you are seeing this message by mistake and your location is not the US, kindly proceed to the website. Otherwise, you must leave the website in order to comply with government restrictions.

Why does your IP address show your location as the USA?

  • - you are using a VPN provided by a hosting company based in the United States;
  • - your IP does not have proper WHOIS records;
  • - an error occurred in the WHOIS geolocation database.

Please confirm whether you are a US resident or not by clicking the relevant button below. If you choose the wrong option, being a US resident, you will not be able to open an account with InstaForex anyway.

We are sorry for any inconvenience caused by this message.