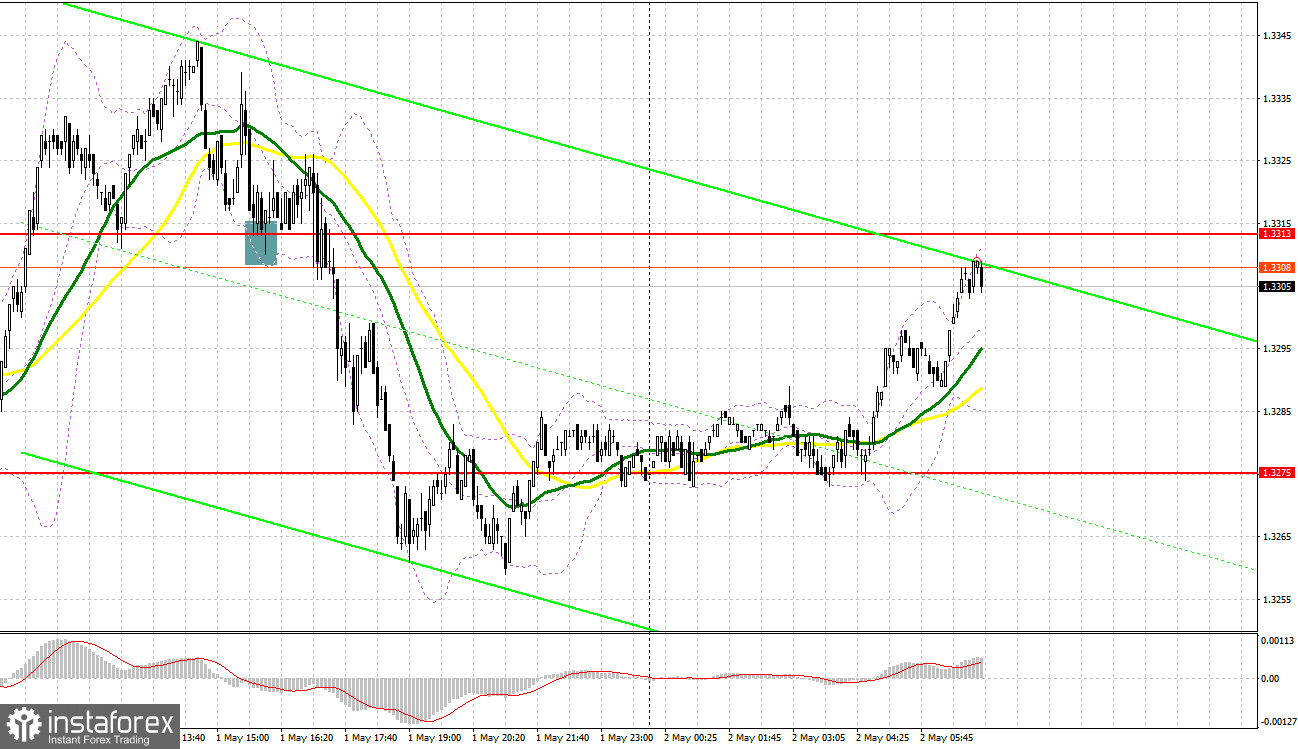
Several entry points into the market were formed yesterday. Let's look at the 5-minute chart and break down what happened. I highlighted the 1.3282 level in my morning forecast and planned to make trading decisions from that area. A decline and the formation of a false breakout around 1.3282 created a good entry point for long positions, which led to a sharp rise to the target level of 1.3325. In the second half of the day, the defense of the new support at 1.3313 also allowed for long positions to be opened, but after a 15-pip increase, pressure on the pair returned.
To Open Long Positions on GBP/USD:
The pound reacted with a sharp drop to the news that manufacturing activity in the U.S. had not declined as much as economists had expected. In April, the PMI for the manufacturing sector even rose slightly to 48.7 compared to a forecast of 48. No data is scheduled for the UK today, so buyers will likely attempt to regain the initiative lost yesterday afternoon. If pressure on the pair resumes and a correction follows the Asian session's gains, in my view, the most attractive level for buying is currently 1.3276, formed at the end of yesterday. I will only consider opening long positions after a false breakout occurs from that level, targeting a retest of resistance at 1.3314. A breakout and downward retest of this range will restore the chances of GBP/USD rising, triggering stop orders from sellers and offering a good long entry opportunity, with the potential to reach resistance at 1.3354. The furthest target will be the 1.3394 area, where I plan to take profit.
If GBP/USD declines and there is no buyer activity at 1.3276, the pair may fall at the end of the week, which would lead to a test of the next support at 1.3240. Only with the formation of a false breakout would there be an appropriate condition for opening long positions. I will look to buy GBP/USD on a bounce from the 1.3205 low, targeting a 30–35 pip correction intraday.
To Open Short Positions on GBP/USD:
Sellers made a strong showing yesterday, but it wasn't enough to maintain control during today's Asian session. If GBP/USD continues to rise amid a lack of data, only a false breakout around 1.3313 will give a reason to open short positions in anticipation of a drop to the nearest support at 1.3276. A breakout and upward retest of that range would deal another blow to buyers' positions, triggering stop orders and opening the path to 1.3240. The ultimate target would be the 1.3205 area, where I plan to take profit. A test of this level would completely erase the recent bullish trend for the pound.
If GBP/USD rises and there's no activity around 1.3313—where the moving averages also pass and support sellers—buyers will try to regain market control. In that case, decisions should be delayed until there has been a test of the 1.3354 resistance level. I plan to open short positions there only on a false breakout. If there's no downward movement even from that level, I will sell GBP/USD on a bounce from 1.3394, targeting only a 30–35 pip downward correction intraday.
Additional Notes:
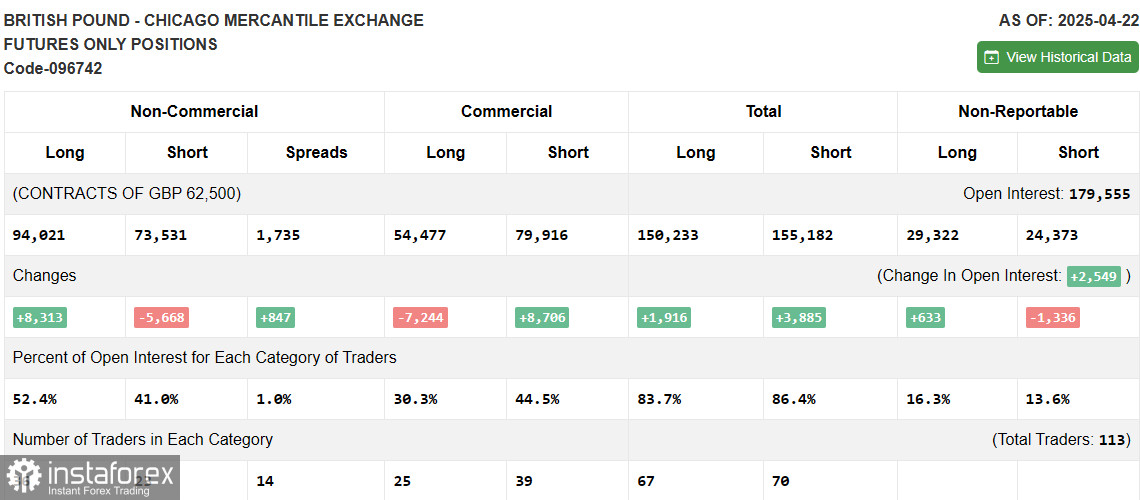
The COT (Commitment of Traders) report for April 22 showed an increase in long positions and a decrease in short positions. Given that the Bank of England is not currently planning to lower interest rates further, this fact supports the pound and allows it to rise against the U.S. dollar. However, a potential compromise on a trade deal between the U.S. and China is having a restraining effect and helping maintain demand for the U.S. dollar. In the near term, data on U.S. economic growth in Q1 and labor market conditions for April will play a decisive role. The latest COT report showed that long non-commercial positions increased by 8,313 to 94,021, while short non-commercial positions decreased by 5,668 to 73,531. As a result, the spread between long and short positions widened by 847.
Indicator Signals:
Moving Averages
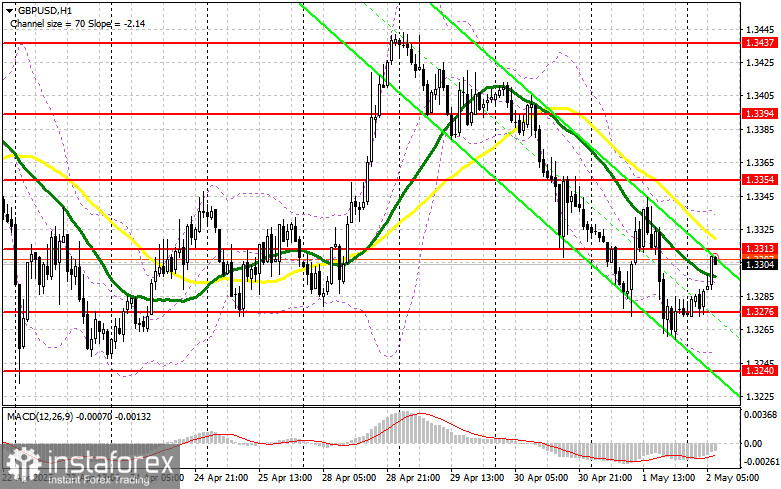
Trading is taking place below the 30- and 50-period moving averages, which indicates a continued decline in the pair.
Note: The author analyzes the moving average periods and prices on the H1 (hourly) chart, which differs from the standard definition of daily moving averages on the D1 (daily) chart.
Bollinger Bands
In the event of a decline, the lower border of the indicator in the region of 1.3250 will act as support.
Indicator Definitions:
• Moving Average – defines the current trend by smoothing out volatility and noise. Period: 50. Marked in yellow on the chart.
• Moving Average – defines the current trend by smoothing out volatility and noise. Period: 30. Marked in green on the chart.
• MACD (Moving Average Convergence/Divergence) – shows convergence/divergence of moving averages. Fast EMA: 12-period, Slow EMA: 26-period, Signal SMA: 9-period.
• Bollinger Bands – measures market volatility. Period: 20.
• Non-commercial traders – speculators such as individual traders, hedge funds, and large institutions using the futures market for speculative purposes and meeting certain requirements.
• Long non-commercial positions – the total long open positions non-commercial traders hold.
• Short non-commercial positions – the total short open positions non-commercial traders hold.
• Net non-commercial position – the difference between short and long positions held by non-commercial traders.