Analysis of Thursday's Trades:
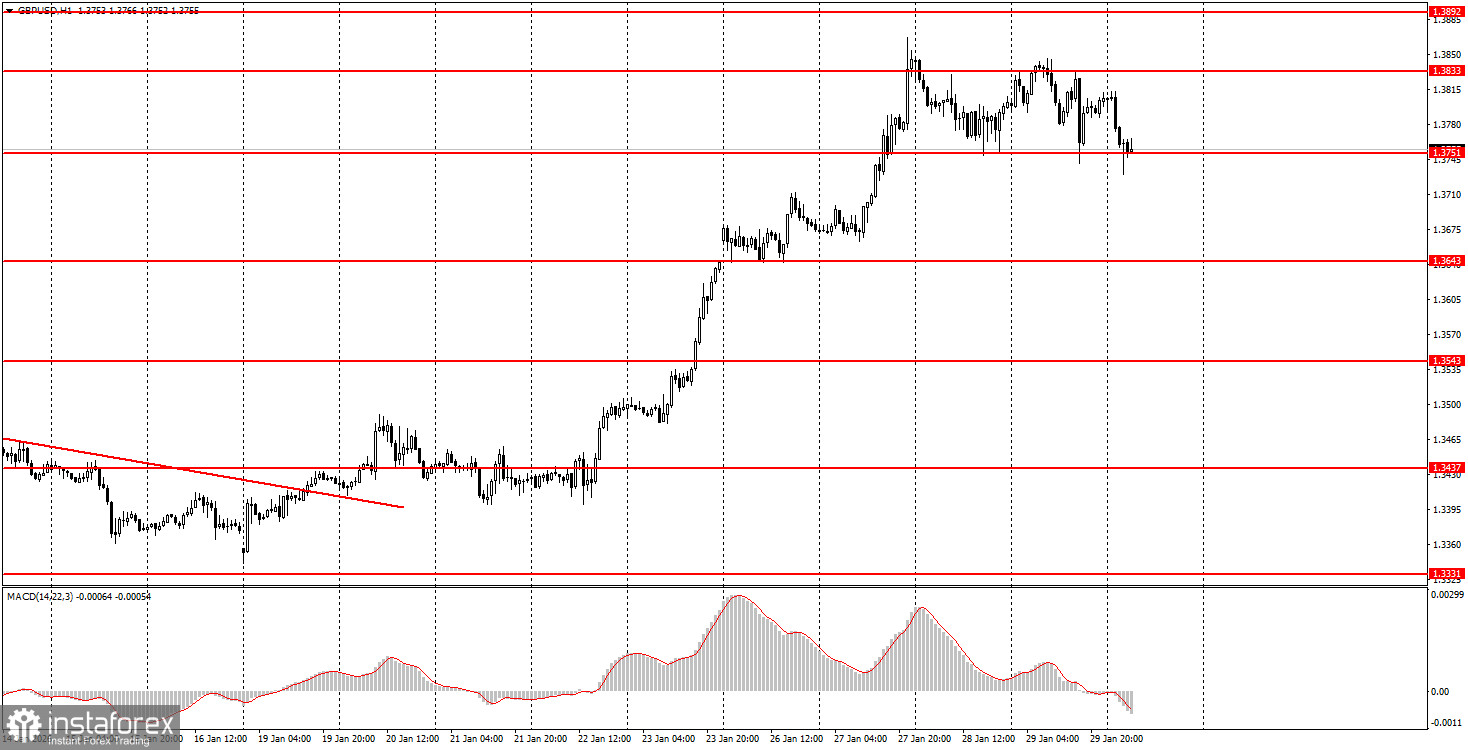
1H Chart of the GBP/USD Pair
The GBP/USD pair continued to correct on Thursday amid a complete lack of macroeconomic and fundamental events. Essentially, after a 450-pip surge, the pair corrected by 100 pip. Over the past two days, there has been a flat consolidation between 1.3751 and 1.3833. However, this calm is unlikely to last long... Already today or tomorrow, Donald Trump may order a missile strike against Iran, which could slightly increase demand for US currency. It's worth remembering that complications in the geopolitical situation worldwide can still provide some support for the dollar, albeit in rare cases. Old habits die hard. In any case, we do not expect significant growth for the dollar. It is also worth noting that a so-called "energy truce" has been reached between Ukraine and Russia, and negotiations for a complete ceasefire are in full swing. The only open question remains—donbas. For the first time in years, there are real chances for the war to come to an end.
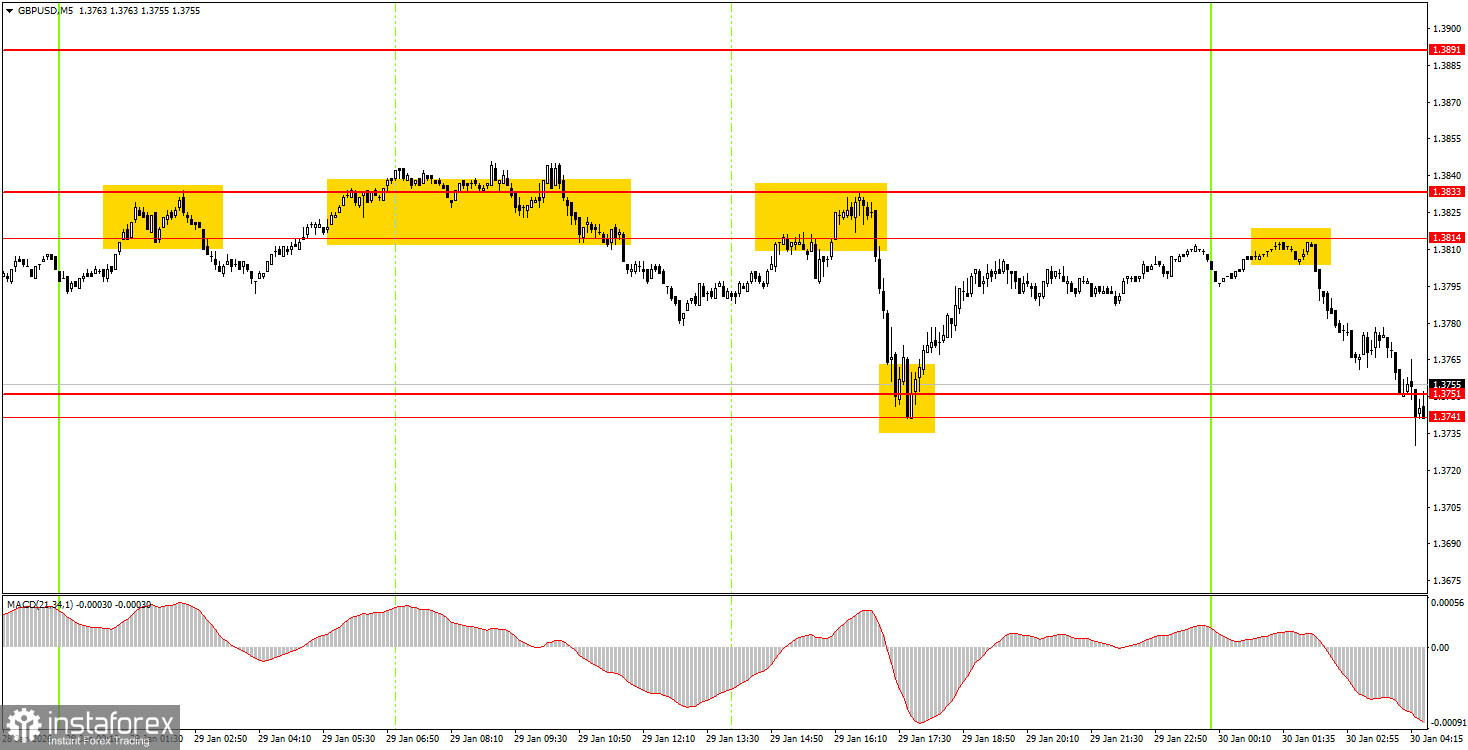
5M Chart of the GBP/USD Pair
On the 5-minute timeframe, similar trading signals were formed as with the EUR/USD pair. The price bounced three times from the resistance area of 1.3814-1.3833 and eventually reached the target area of 1.3741-1.3751. The bounce from this area led to a return to 1.3814-1.3833. Thus, beginner traders could have opened three trades yesterday: two were profitable, and the third closed at breakeven.
How to Trade on Friday:
On the hourly timeframe, the GBP/USD pair has reversed upwards, suggesting that the British pound could appreciate in the coming weeks. No global factors are driving medium-term dollar growth, so we expect the global upward trend from 2025 to continue, which could push the pair to 1.4000 soon. Donald Trump's policies still do not indicate strengthening of the American currency.
On Friday, novice traders may consider opening new short positions if the pair consolidates below the 1.3741-1.3751 area, targeting 1.3643-1.3652. A bounce from the 1.3643-1.3652 area will allow long positions to be opened with targets at 1.3814-1.3833.
On the 5-minute timeframe, key levels to consider include 1.3319-1.3331, 1.3365, 1.3403-1.3407, 1.3437-1.3446, 1.3484-1.3489, 1.3529-1.3543, 1.3574-1.3590, 1.3643-1.3652, 1.3741-1.3751, 1.3814-1.3832, 1.3891-1.3912, 1.3975. On Friday, there are no significant events scheduled in the UK, while the only data to be published in the US will be the Producer Price Index, which is unlikely to provoke a noticeable market reaction. There is a much higher probability that Donald Trump will trigger a new "storm" in the market.
Main rules of the trading system:
- Signal strength is judged by the time required to form the signal (rebound or breakout). The less time required, the stronger the signal.
- If two or more trades were opened on false signals near a level, then all subsequent signals from that level should be ignored.
- In a flat, any pair can generate many false signals or none at all. In any case, at the first signs of a flat, it is better to stop trading.
- Trades are opened between the start of the European session and the middle of the American session; after that, all trades must be closed manually.
- On the hourly timeframe, MACD-based signals should be traded only when there is good volatility and a trend confirmed by a trendline or trend channel.
- If two levels are located too close to each other (5–20 pips), they should be considered a support or resistance area.
- After the price moves 20 pips in the correct direction, set the stop loss to breakeven.
What is shown on the charts:
Support and resistance price levels — levels that serve as targets when opening buys or sells. Take Profit can be placed near them.
Red lines — channels or trendlines that reflect the current tendency and show which direction is preferable to trade now.
MACD indicator (14,22,3) — histogram and signal line — an auxiliary indicator that can also be used as a source of signals.
Important speeches and reports (always listed in the news calendar) can strongly affect a currency pair's movement. Therefore, during their release, trading should be done with maximum caution, or positions should be closed, to avoid a sharp price reversal against the preceding move.
Beginner forex traders should remember that not every trade can be profitable. Developing a clear strategy and effective money management are the keys to long-term trading success.