signal strength 1 of 5

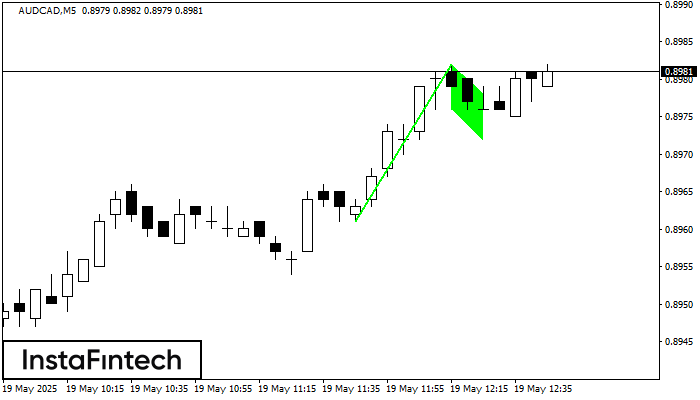
The Bullish Flag pattern has been formed on AUDCAD at M5. The lower boundary of the pattern is located at 0.8976/0.8972, while the higher boundary lies at 0.8982/0.8978. The projection of the flagpole is 21 points. This formation signals that the upward trend is most likely to continue. Therefore, if the level of 0.8982 is broken, the price will move further upwards.
The M5 and M15 time frames may have more false entry points.
Vea asimismo
- All
- Double Top
- Flag
- Head and Shoulders
- Pennant
- Rectangle
- Triangle
- Triple top
- All
- #AAPL
- #AMZN
- #Bitcoin
- #EBAY
- #FB
- #GOOG
- #INTC
- #KO
- #MA
- #MCD
- #MSFT
- #NTDOY
- #PEP
- #TSLA
- #TWTR
- AUDCAD
- AUDCHF
- AUDJPY
- AUDUSD
- EURCAD
- EURCHF
- EURGBP
- EURJPY
- EURNZD
- EURRUB
- EURUSD
- GBPAUD
- GBPCHF
- GBPJPY
- GBPUSD
- GOLD
- NZDCAD
- NZDCHF
- NZDJPY
- NZDUSD
- SILVER
- USDCAD
- USDCHF
- USDJPY
- USDRUB
- All
- M5
- M15
- M30
- H1
- D1
- All
- Buy
- Sale
- All
- 1
- 2
- 3
- 4
- 5
En el gráfico de SILVER M5 el patrón de reversión Doble Techo ha sido formado. Características: límite superior 34.51; límite inferior 34.41; el ancho del patrón 95 puntos. La señal
Los marcos de tiempo M5 y M15 pueden tener más puntos de entrada falsos.
Open chart in a new windowEl patrón Triple Piso ha sido formado en el gráfico de USDJPY M15. Características del patrón: línea inferior del patrón tiene coordenadas 142.94 con el límite superior 142.94/142.84, la proyección
Los marcos de tiempo M5 y M15 pueden tener más puntos de entrada falsos.
Open chart in a new windowSegún el gráfico de M15, NZDCHF formó el Rectángulo Bajista que es un patrón de la continuación de una tendencia. El patrón está contenido dentro de los siguientes límites: límite
Los marcos de tiempo M5 y M15 pueden tener más puntos de entrada falsos.
Open chart in a new window