empty
01.11.2023 06:45 AM
EUR/USD and GBP/USD: Technical analysis for November 1

EUR/USD

This image is no longer relevant

Higher Timeframes

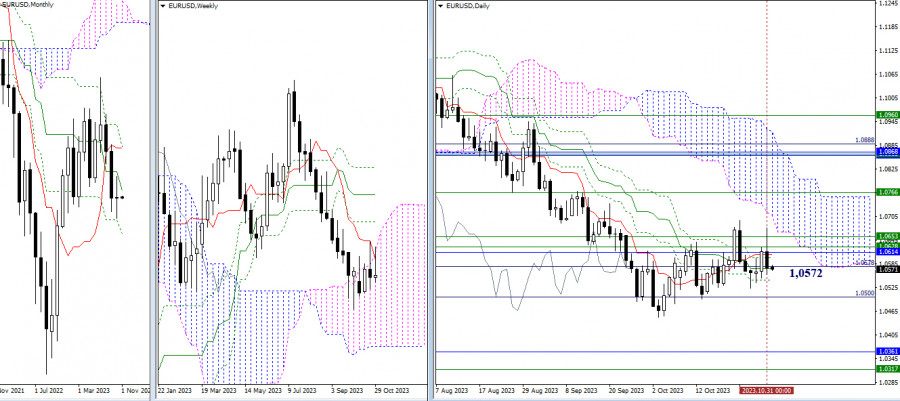
October closed with a candle of uncertainty. The market continues to operate within the range of daily levels, with the center of attraction being the medium-term trend (1.0572). At the start of the new trading month, minor adjustments to the Ichimoku indicator on the monthly timeframe led to the strengthening of the current weekly resistance zone (1.0628 - 1.0653) by the monthly medium-term trend (1.0614). As a result, the immediate objectives for bullish players, at the moment, are breaking through resistance levels (1.0614-28-53), updating the high (1.0695), and entering the daily cloud.

In the current situation, bearish players' prospects are focused on breaking through supports at 1.0500 - 1.0449 (the daily target level + the low) and declining towards the final level of the monthly Ichimoku cross (1.0360) and the lower boundary of the weekly cloud (1.0317).

This image is no longer relevant

H4 – H1

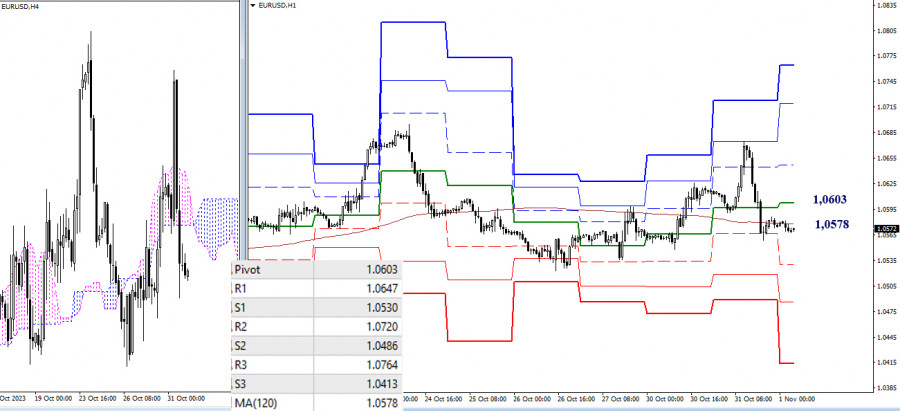
On the lower timeframes, there is also uncertainty in the past few hours. The market is hovering around the attraction zone of the weekly long-term trend (1.0578). The moving average is currently in a nearly horizontal position, confirming the balance of power. In the event of bearish activity and a strengthening of their sentiments, attention will be on passing through the supports of the classic pivot points (1.0530 - 1.0486 - 1.0413). If bulls restore their positions, their interests will shift towards breaking through the resistances of the classic pivot points (1.0603 - 1.0647 - 1.0720 - 1.0764).

***

GBP/USD

This image is no longer relevant

Higher Timeframes

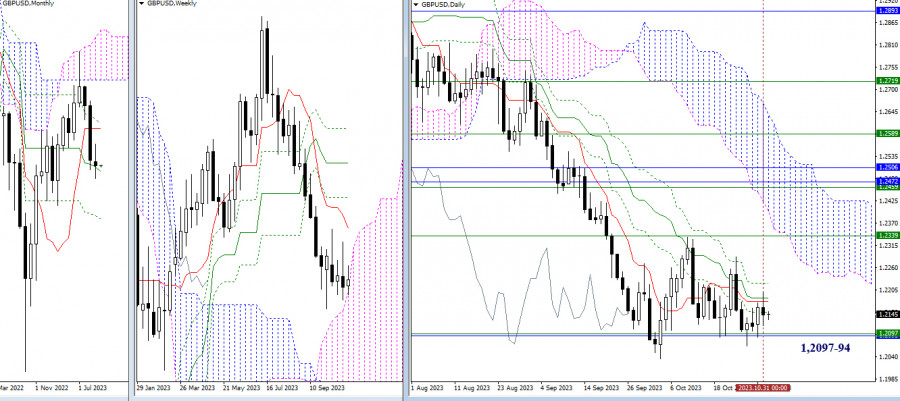
October did not provide clear support to any market players. The pair continues to consolidate around the upper boundary of the weekly cloud (1.2097). Most likely, the pound has decided to enter the weekly cloud in a sideways movement while utilizing the support of the monthly medium-term trend (1.2094). Only directed movement can change the situation. For bullish players, it is still important to overcome the attraction of the daily cross levels (1.2151 - 1.2178 - 1.2186 - 1.2221) and secure the support of the weekly short-term trend (1.2339). For bears, it is necessary to break free from the attraction of levels 1.2094 - 1.2097 and restore the downward trend (1.2036) to continue the decline.

This image is no longer relevant

H4 – H1

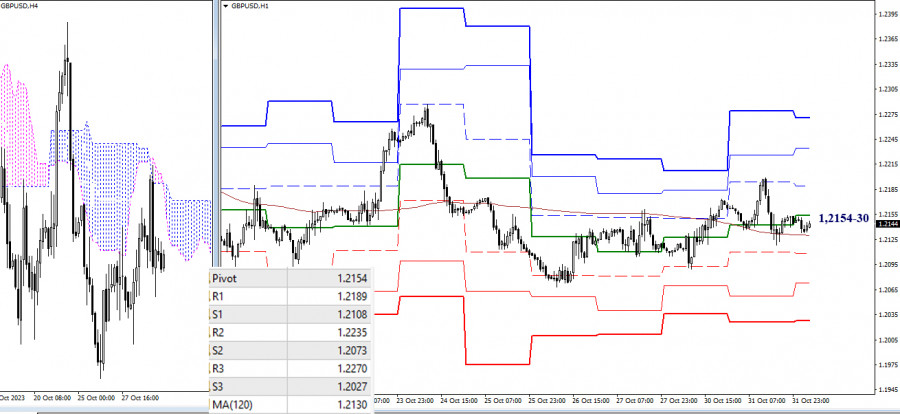
On the lower timeframes, the market is in a state of uncertainty and attraction to key levels, which are currently converging in the 1.2154-30 range (central pivot point + weekly long-term trend). Trading below these key levels will favor the development of bearish sentiments. Intraday bearish targets today are at 1.2108 - 1.2073 - 1.2027 (classic pivot points). Trading above these key levels will contribute to the strengthening of bullish positions. Intraday bullish targets can be noted at 1.2189 - 1.2235 - 1.2270 (resistances of the classic pivot points).

***

The technical analysis of the situation uses:

Higher timeframes - Ichimoku Kinko Hyo (9.26.52) + Fibo Kijun levels

Lower timeframes - H1 - Pivot Points (classic) + Moving Average 120 (weekly long-term trend)

เลือกช่วงเวลา
5
นาที
15
นาที
30
นาที
1
ชั่วโมง
4
ชั่วโมง
1
วัน
1
สัปดาห์
รับผลกำไรจากการเปลี่ยนแปลงอัตราสกุลเงินดิจิทัลกับ InstaForex.
ดาวน์โหลด MetaTrader 4 และเปิดการซื้อขายครั้งแรกของคุณ.
USD/CAD: การวิเคราะห์และการพยากรณ์ คู่เงิน USD/CAD ได้ฟื้นตัวเป็นวันที่สามติดต่อกันจากระดับต่ำสุดในปีนี้ ได้รับการสนับสนุนจากความสนใจในการซื้อเงินดอลลาร์สหรัฐที่เพิ่มขึ้น ข้อมูลเศรษฐกิจสหรัฐที่ออกมามีความหวังเมื่อวานนี้ช่วยให้ภาวะเศรษฐกิจถดถอยผ่อนคลายลง และสนับสนุนดัชนีดอลลาร์ DXY ส่งผลในเชิงบวกต่อคู่เงิน USD/CAD อย่างไรก็ตาม การรวมตัวของปัจจัยต้องการความระมัดระวังจากนักลงทุนที่หวังในแนวโน้มการเติบโตของดอลลาร์ นักลงทุนยังคงระวังเกี่ยวกับความกังวลที่เพิ่มขึ้นเกี่ยวกับมุมมองด้านการคลังที่เสื่อมโทรมของสหรัฐ คาดการณ์ยังมีเพิ่มขึ้นว่าธนาคารกลางสหรัฐอาจลดอัตราดอกเบี้ยอย่างน้อยสองครั้งในปี 2025 ซึ่งอาจจำกัดศักยภาพการขึ้นของทั้งดอลลาร์สหรัฐและคู่เงิน
  • Grand Choice
    Contest by
    InstaForex
    InstaForex always strives to help you
    fulfill your biggest dreams.
    เข้าร่วมการแข่งขัน


บทความแนะนำ

การพยากรณ์สำหรับ EUR/USD ในวันที่ 28 พฤษภาคม 2025

เมื่อวันอังคาร คู่เงิน EUR/USD ได้มีการเคลื่อนตัวรวมอยู่ที่ต่ำกว่าบริเวณ 1.1374–1.1380 และต่อมาเด้งกลับด้านล่างบริเวณดังกล่าว ซึ่งเป็นการยืนยันถึงแนวโน้มขาลงต่อไป และการปิดต่ำกว่า 50.0% ระดับการเก็บกำไรคืนที่ 1.1320 บ่งบอกว่าคู่นี้อาจมีแนวโน้มลดลงต่อไปสู่บริเวณ 1.1260–1.1282 การเด้งกลับจากระดับหรือโซนสนับสนุนใดๆ อาจเป็นชนวนให้เกิดการปรับตัวขึ้นใหม่อีกครั้ง

Samir Klishi 11:32 2025-05-28 UTC+2

การคาดการณ์ Forex วันที่ 28/05/2025: NZD/USD, EUR/USD, USD/JPY, ทองคำ, และ Bitcoin

ลิงก์ที่มีประโยชน์: บทความอื่นๆ ของฉันอยู่ในส่วนนี้ คอร์สพื้นฐานสำหรับผู้เริ่มต้นของ InstaForex การวิเคราะห์ที่ได้รับความนิยม เปิดบัญชีซื้อขาย สำคัญ: ผู้เริ่มต้นในตลาดแลกเปลี่ยนเงินตราต่างประเทศ (forex trading) ควรระมัดระวังอย่างยิ่งเมื่อทำการตัดสินใจเกี่ยวกับการเข้าสู่ตลาด ก่อนที่จะมีการเผยแพร่รายงานที่สำคัญ ควรหลีกเลี่ยงการเข้าสู่ตลาดเพื่อป้องกันการผันผวนที่รุนแรงซึ่งเกิดจากความเปลี่ยนแปลงของความผันผวนที่เพิ่มขึ้น หากคุณตัดสินใจที่จะทำการซื้อขายในช่วงที่มีการเผยแพร่ข่าว

Sebastian Seliga 10:44 2025-05-28 UTC+2

GBP/USD – 28 พฤษภาคม: รายงานประชุม FOMC จะส่งผลต่อการตลาดอย่างไร?

ในชาร์ตรายชั่วโมงของคู่เงิน GBP/USD ราคายังคงลดลงต่อไปในวันอังคารและยืนใต้ระดับ Fibonacci retracement 161.8% ที่ 1.3520 ซึ่งหมายความว่าแนวโน้มขาลงอาจจะดำเนินต่อไปในวันนี้ไปสู่เป้าหมายถัดไปที่ 1.3425 การยืนเหนือ 1.3520 หรือการรีบาวน์จาก 1.3425 จะเป็นปัจจัยบวกต่อสกุลเงินปอนด์และส่งสัญญาณถึงการกลับมาเติบโตอีกครั้ง

Samir Klishi 09:54 2025-05-28 UTC+2

การวิเคราะห์ทางเทคนิคของการเคลื่อนไหวของราคาในระหว่างวันของคู่สกุลเงินไขว้ AUD/JPY, วันพุธที่ 28 พฤษภาคม 2025

เมื่อเกิดการบรรจบกันระหว่างการเคลื่อนไหวของคู่สกุลเงิน AUD/JPY กับตัวบ่งชี้ Stochastic Oscillator ซึ่งได้รับการยืนยันเพิ่มเติมจากการเคลื่อนไหวของราคาที่กำลังเคลื่อนที่เหนือ WMA (21) ที่มีแนวโน้มเอียงขึ้นไปในกราฟ 4 ชั่วโมง ในอนาคตอันใกล้นี้ AUD/JPY มีโอกาสที่จะเสริมสร้างไปทางทิศเหนือ ซึ่งระดับ

Arief Makmur 08:39 2025-05-28 UTC+2

การคาดการณ์ EUR/USD สำหรับวันที่ 28 พฤษภาคม 2025

ในวันอังคาร ยูโรเผชิญการปรับตัวทางเทคนิคจากระดับแนวต้านที่ 1.1420 ในวันเดียวกัน ราคาทองคำได้ปรับตัวลดลง 1.14%, น้ำมันดิบ WTI ลดลง 0.44%, และผลตอบแทนพันธบัตรรัฐบาลก็ปรับตัวลดลง อย่างไรก็ตาม ตลาดหุ้นยังคงมีความเคลื่อนไหวในทางบวก ซึ่งสัญญาณถึงความต้องการความเสี่ยงที่ยังคงมีอยู่ (S&P

Laurie Bailey 05:08 2025-05-28 UTC+2

การพยากรณ์ GBP/USD สำหรับวันที่ 28 พฤษภาคม 2025

ในวันอังคาร ค่าเงินปอนด์อังกฤษชะงักเพื่อเข้าสู่ช่องแคบระหว่างเส้นช่องราคากับระดับเป้าหมายที่ 1.3635 ในบริบทที่ดัชนีดอลลาร์สหรัฐเพิ่มขึ้น 0.42% ความพยายามดังกล่าวน่าจะล้มเหลว ขณะนี้ราคากำลังอยู่ในช่วงการรวมตัวเพื่อเตรียมพร้อมสำหรับการเคลื่อนไหวขึ้นในที่สุด การทะลุผ่านลิ่มที่จุดแคบที่สุดโดยเฉพาะอย่างยิ่งที่จุดยอด "แม่เหล็ก" ของลิ่มนั้นท้าทายมากยิ่งขึ้น ขณะนี้ออสซิลเลเตอร์ Marlin ที่ลดลงช่วยให้มีการทดสอบระดับการสนับสนุนที่ 1.3433 เมื่อลงตัวแก้ไขเสร็จสมบูรณ์แล้ว

Laurie Bailey 05:08 2025-05-28 UTC+2

การคาดการณ์อัตรา USD/JPY สำหรับวันที่ 28 พฤษภาคม 2025

เมื่อวานนี้ คู่เงิน USD/JPY มีการเติบโตที่แข็งแกร่ง—0.90% หรือ 149 pips—ซึ่งเป็นผลมาจากการแข็งค่าขึ้นของดัชนีดอลลาร์สหรัฐฯ ที่ 0.42% ทำให้ราคาขณะนี้มีการซื้อขายอยู่เหนือสมดุลรายวัน และเส้นของตัวบ่งชี้ MACD นอกจากนี้ออสซิลเลเตอร์ Marlin ก็เคลื่อนตัวเข้าสู่แดนบวกแล้วด้วย

Laurie Bailey 05:08 2025-05-28 UTC+2

EUR/JPY: สถานการณ์ตลาดปัจจุบันและการคาดการณ์

วันนี้ คู่สกุลเงิน EUR/JPY กำลังดึงดูดผู้ซื้อหลังจากลดลงในช่วงตลาดเอเชียสู่ระดับสำคัญที่ 162.00 จากมุมมองด้านเทคนิค ตัวชี้วัดออสซิลเลเตอร์บนแผนภูมิรายชั่วโมงและรายวันได้เปลี่ยนเป็นบวกแล้ว และแม้ว่าหนึ่งจะพลาดซ้ำใกล้ค่าเฉลี่ยเคลื่อนที่อย่างง่าย 200 ชั่วโมง (SMA) บนแผนภูมิรายชั่วโมงซึ่งปัจจุบันตั้งอยู่รอบระดับ 162.70 ราคาตลาดได้มีการพลิกกลับขึ้นไปเหนือขีดจำกัดนี้ นี่บ่งบอกว่าฝ่ายกระทิงคุมสถานการณ์อยู่

Irina Yanina 19:28 2025-05-27 UTC+2

สัญญาณการซื้อขายสำหรับทองคำ (XAU/USD) วันที่ 27-29 พฤษภาคม 2025: ซื้อเมื่อราคาเกิน $3,281 (6/8 Murray - 21 SMA)

ในช่วงต้นของการซื้อขายสหรัฐฯ ทองคำกำลังซื้อขายอยู่ราว ๆ 3,294 โดยมีการดีดขึ้นหลังจากที่แตะจุดต่ำสุดของช่องแนวโน้มขาขึ้นที่เกิดขึ้นเมื่อวันที่ 14 พฤษภาคม ซึ่งอยู่เหนือระดับ 6/8 ของ Murray และต่ำกว่า 21st SMA ทองคำมีการปรับตัวทางเทคนิคอย่างรวดเร็วในระหว่างการซื้อขายยุโรป

Dimitrios Zappas 18:33 2025-05-27 UTC+2

สัญญาณการเทรดสำหรับ EUR/USD วันที่ 27-29 พฤษภาคม: ขายต่ำกว่า 1.1350 (21 SMA - 7/8 Murray)

ในช่วงต้นของการซื้อขายอเมริกา EUR/USD คู่สกุลเงินกำลังซื้อขายอยู่ที่ประมาณ 1.3056 ภายในกรอบแนวโน้มขาขึ้น แสดงสัญญาณการหมดแรง ยูโรพยายามที่จะทะลุแนวต้านรายสัปดาห์ที่ 1.1418 ในช่วงการซื้อขายยุโรป แต่ไม่สำเร็จ คู่สกุลเงิน EUR/USD ไม่มีพลังในการขาขึ้นและขณะนี้เราจะเห็นการลดลงต่อเนื่องในชั่วโมงต่อจากนี้ ถ้าหากราคาปิดต่ำกว่า 1.1350

Dimitrios Zappas 18:31 2025-05-27 UTC+2
หากไม่สะดวกคุยในตอนนี้
ระบุคำถามไว้ได้ใน แชท.
Widget callback
 

Dear visitor,

Your IP address shows that you are currently located in the USA. If you are a resident of the United States, you are prohibited from using the services of InstaFintech Group including online trading, online transfers, deposit/withdrawal of funds, etc.

If you think you are seeing this message by mistake and your location is not the US, kindly proceed to the website. Otherwise, you must leave the website in order to comply with government restrictions.

Why does your IP address show your location as the USA?

  • - you are using a VPN provided by a hosting company based in the United States;
  • - your IP does not have proper WHOIS records;
  • - an error occurred in the WHOIS geolocation database.

Please confirm whether you are a US resident or not by clicking the relevant button below. If you choose the wrong option, being a US resident, you will not be able to open an account with InstaForex anyway.

We are sorry for any inconvenience caused by this message.