signal strength 3 of 5

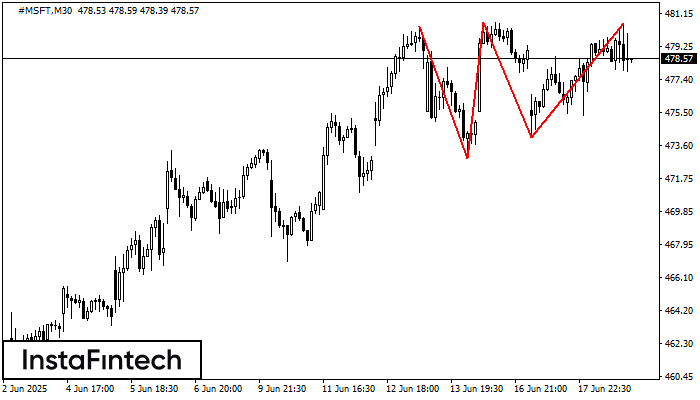
The Triple Top pattern has formed on the chart of the #MSFT M30. Features of the pattern: borders have an ascending angle; the lower line of the pattern has the coordinates 472.89/474.09 with the upper limit 480.39/480.60; the projection of the width is 750 points. The formation of the Triple Top figure most likely indicates a change in the trend from upward to downward. This means that in the event of a breakdown of the support level of 472.89, the price is most likely to continue the downward movement.
Juga lihat
- All
- Double Top
- Flag
- Head and Shoulders
- Pennant
- Rectangle
- Triangle
- Triple top
- All
- #AAPL
- #AMZN
- #Bitcoin
- #EBAY
- #FB
- #GOOG
- #INTC
- #KO
- #MA
- #MCD
- #MSFT
- #NTDOY
- #PEP
- #TSLA
- #TWTR
- AUDCAD
- AUDCHF
- AUDJPY
- AUDUSD
- EURCAD
- EURCHF
- EURGBP
- EURJPY
- EURNZD
- EURRUB
- EURUSD
- GBPAUD
- GBPCHF
- GBPJPY
- GBPUSD
- GOLD
- NZDCAD
- NZDCHF
- NZDJPY
- NZDUSD
- SILVER
- USDCAD
- USDCHF
- USDJPY
- USDRUB
- All
- M5
- M15
- M30
- H1
- D1
- All
- Buy
- Sale
- All
- 1
- 2
- 3
- 4
- 5
Berdasarkan carta M5, GBPCHF membentuk corak Segi Tiga Simetri Menaik. Sempadan yang lebih rendah bagi corak yang menyentuh koordinat 1.0926/1.0931 di mana sempadan atas merentasi 1.0935/1.0931. Sekiranya corak Segi Tiga
Carta masa M5 dan M15 mungkin mempunyai lebih banyak titik kemasukan palsu.
Open chart in a new windowCorak Triple Bottom telah dibentuk pada NZDJPY M5. Ia mempunyai ciri-ciri berikut: tahap rintangan 87.76/87.71; tahap sokongan 87.60/87.59; lebar corak adalah 16 mata. Dalam situasi penembusan paras rintangan 87.76, harga
Carta masa M5 dan M15 mungkin mempunyai lebih banyak titik kemasukan palsu.
Open chart in a new windowCorak Triple Bottom telah dibentuk pada carta bagi instrumen dagangan GBPJPY M5. Corak menandakan perubahan aliran dari menurun ke aliran menaik dalam sekiranya penembusan 199.19/199.17
Carta masa M5 dan M15 mungkin mempunyai lebih banyak titik kemasukan palsu.
Open chart in a new window