signal strength 2 of 5
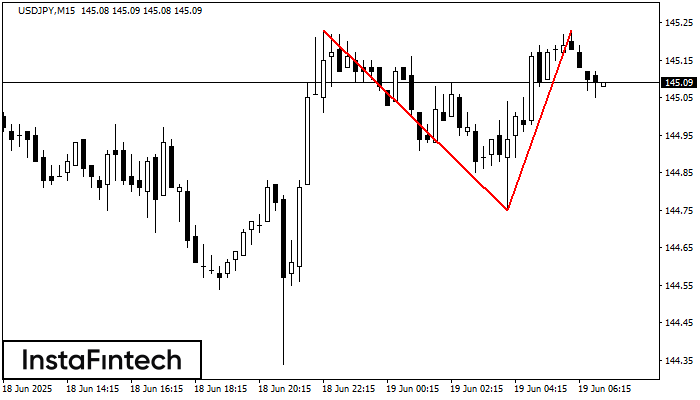
The Double Top pattern has been formed on USDJPY M15. It signals that the trend has been changed from upwards to downwards. Probably, if the base of the pattern 144.75 is broken, the downward movement will continue.
The M5 and M15 time frames may have more false entry points.
See Also
- All
- Double Top
- Flag
- Head and Shoulders
- Pennant
- Rectangle
- Triangle
- Triple top
- All
- #AAPL
- #AMZN
- #Bitcoin
- #EBAY
- #FB
- #GOOG
- #INTC
- #KO
- #MA
- #MCD
- #MSFT
- #NTDOY
- #PEP
- #TSLA
- #TWTR
- AUDCAD
- AUDCHF
- AUDJPY
- AUDUSD
- EURCAD
- EURCHF
- EURGBP
- EURJPY
- EURNZD
- EURRUB
- EURUSD
- GBPAUD
- GBPCHF
- GBPJPY
- GBPUSD
- GOLD
- NZDCAD
- NZDCHF
- NZDJPY
- NZDUSD
- SILVER
- USDCAD
- USDCHF
- USDJPY
- USDRUB
- All
- M5
- M15
- M30
- H1
- D1
- All
- Buy
- Sale
- All
- 1
- 2
- 3
- 4
- 5
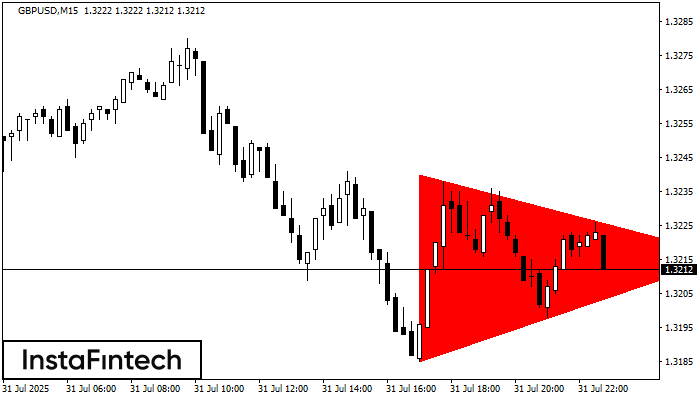
According to the chart of M15, GBPUSD formed the Bearish Symmetrical Triangle pattern. Description: The lower border is 1.3185/1.3216 and upper border is 1.3240/1.3216. The pattern width is measured
The M5 and M15 time frames may have more false entry points.
Open chart in a new window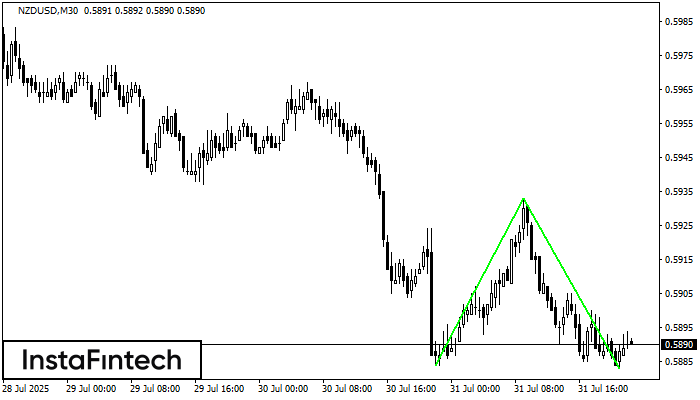
The Double Bottom pattern has been formed on NZDUSD M30. Characteristics: the support level 0.5884; the resistance level 0.5933; the width of the pattern 49 points. If the resistance level
Open chart in a new window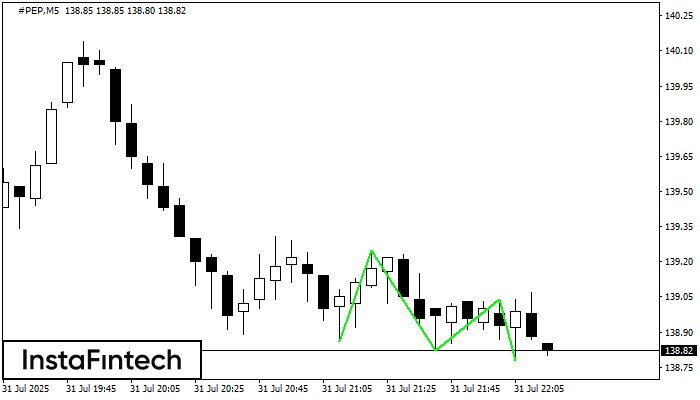
The Triple Bottom pattern has formed on the chart of #PEP M5. Features of the pattern: The lower line of the pattern has coordinates 139.25 with the upper limit 139.25/139.04
The M5 and M15 time frames may have more false entry points.
Open chart in a new window