signal strength 2 of 5
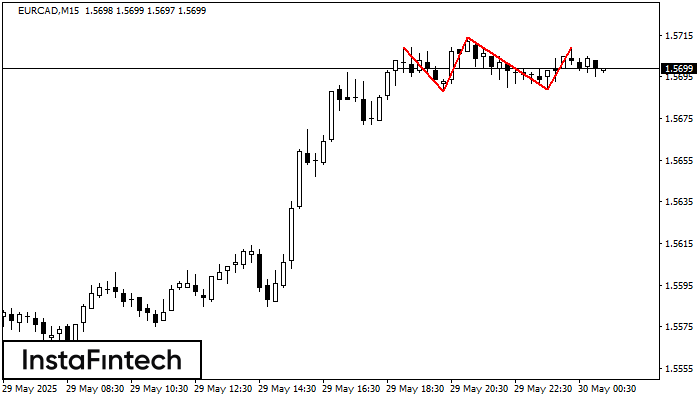
On the chart of the EURCAD M15 trading instrument, the Triple Top pattern that signals a trend change has formed. It is possible that after formation of the third peak, the price will try to break through the resistance level 1.5688, where we advise to open a trading position for sale. Take profit is the projection of the pattern’s width, which is 21 points.
The M5 and M15 time frames may have more false entry points.
See Also
- All
- Double Top
- Flag
- Head and Shoulders
- Pennant
- Rectangle
- Triangle
- Triple top
- All
- #AAPL
- #AMZN
- #Bitcoin
- #EBAY
- #FB
- #GOOG
- #INTC
- #KO
- #MA
- #MCD
- #MSFT
- #NTDOY
- #PEP
- #TSLA
- #TWTR
- AUDCAD
- AUDCHF
- AUDJPY
- AUDUSD
- EURCAD
- EURCHF
- EURGBP
- EURJPY
- EURNZD
- EURRUB
- EURUSD
- GBPAUD
- GBPCHF
- GBPJPY
- GBPUSD
- GOLD
- NZDCAD
- NZDCHF
- NZDJPY
- NZDUSD
- SILVER
- USDCAD
- USDCHF
- USDJPY
- USDRUB
- All
- M5
- M15
- M30
- H1
- D1
- All
- Buy
- Sale
- All
- 1
- 2
- 3
- 4
- 5
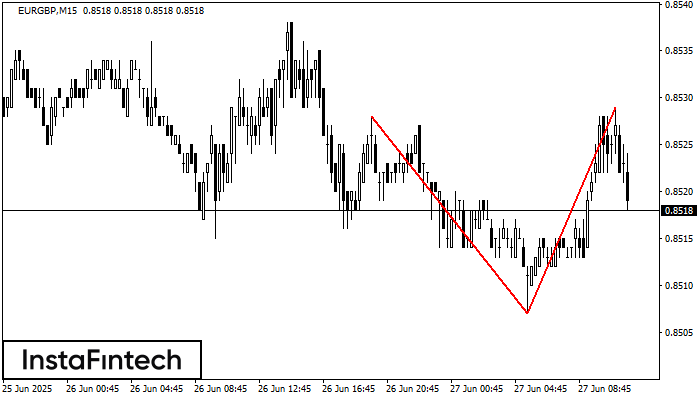
On the chart of EURGBP M15 the Double Top reversal pattern has been formed. Characteristics: the upper boundary 0.8529; the lower boundary 0.8507; the width of the pattern 22 points
The M5 and M15 time frames may have more false entry points.
Open chart in a new window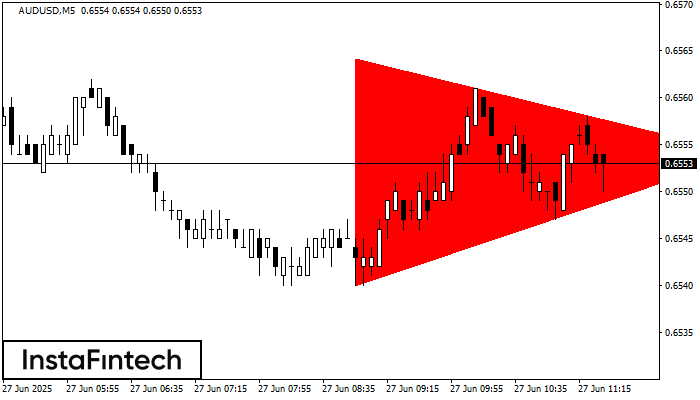
According to the chart of M5, AUDUSD formed the Bearish Symmetrical Triangle pattern. Trading recommendations: A breach of the lower border 0.6540 is likely to encourage a continuation
The M5 and M15 time frames may have more false entry points.
Open chart in a new window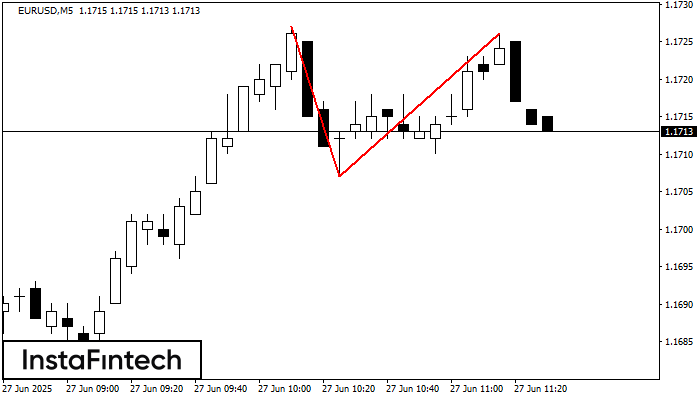
On the chart of EURUSD M5 the Double Top reversal pattern has been formed. Characteristics: the upper boundary 1.1726; the lower boundary 1.1707; the width of the pattern 19 points
The M5 and M15 time frames may have more false entry points.
Open chart in a new window