signal strength 1 of 5
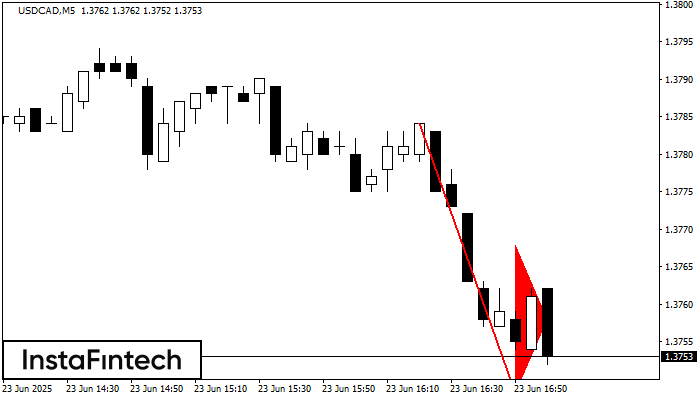
The Bearish pennant pattern has formed on the USDCAD M5 chart. It signals potential continuation of the existing trend. Specifications: the pattern’s bottom has the coordinate of 1.3748; the projection of the flagpole height is equal to 36 pips. In case the price breaks out the pattern’s bottom of 1.3748, the downtrend is expected to continue for further level 1.3733.
The M5 and M15 time frames may have more false entry points.
See Also
- All
- Double Top
- Flag
- Head and Shoulders
- Pennant
- Rectangle
- Triangle
- Triple top
- All
- #AAPL
- #AMZN
- #Bitcoin
- #EBAY
- #FB
- #GOOG
- #INTC
- #KO
- #MA
- #MCD
- #MSFT
- #NTDOY
- #PEP
- #TSLA
- #TWTR
- AUDCAD
- AUDCHF
- AUDJPY
- AUDUSD
- EURCAD
- EURCHF
- EURGBP
- EURJPY
- EURNZD
- EURRUB
- EURUSD
- GBPAUD
- GBPCHF
- GBPJPY
- GBPUSD
- GOLD
- NZDCAD
- NZDCHF
- NZDJPY
- NZDUSD
- SILVER
- USDCAD
- USDCHF
- USDJPY
- USDRUB
- All
- M5
- M15
- M30
- H1
- D1
- All
- Buy
- Sale
- All
- 1
- 2
- 3
- 4
- 5
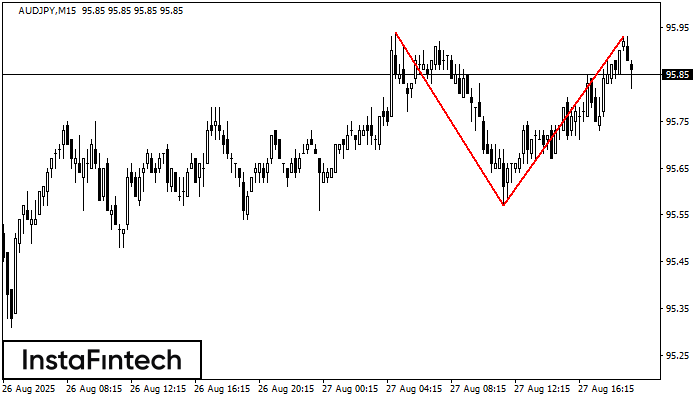
Pada carta AUDJPY M15 corak pembalikan Double Top telah terbentuk. Ciri-ciri: sempadan atas 95.93; sempadan bawah 95.57; lebar corak 36 mata. Isyarat: penembusan sempadan bawah akan menyebabkan kesinambungan arah aliran
Carta masa M5 dan M15 mungkin mempunyai lebih banyak titik kemasukan palsu.
Open chart in a new window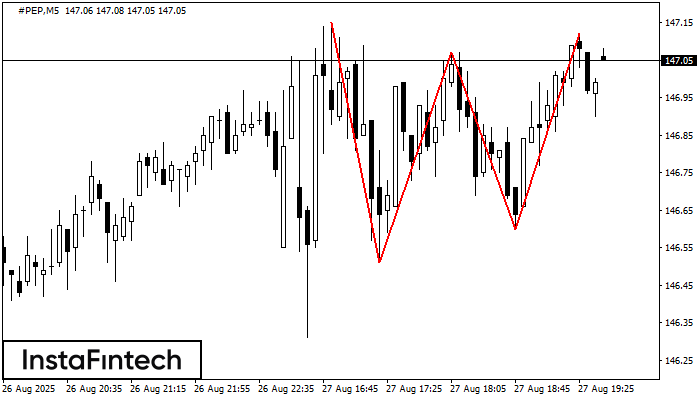
Corak Triple Top telah dibentuk pada carta bagi instrumen dagangan #PEP M5. Ia adalah corak pembalikan yang memaparkan ciri-ciri berikut: tahap rintangan 3, tahap sokongan -9, dan lebar corak
Carta masa M5 dan M15 mungkin mempunyai lebih banyak titik kemasukan palsu.
Open chart in a new window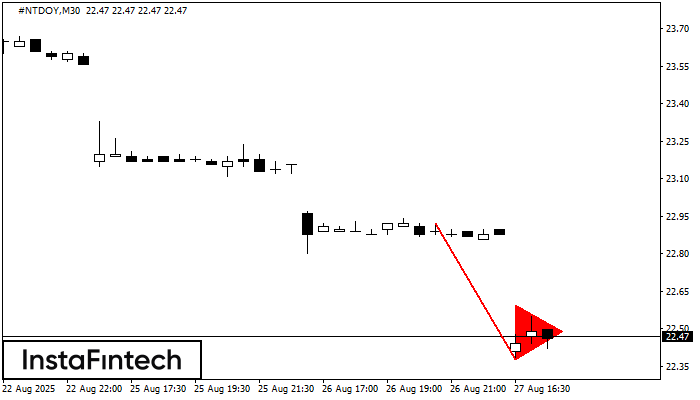
Corak Pennant Aliran Menurun telah dibentuk pada carta #NTDOY M30. Corak menandakan kesinambungan aliran menurun sekiranya aliran pennant rendah 22.38 ditembusi. Cadangan: Meletakkan pesanan penanguhan sell stop
Open chart in a new window