signal strength 4 of 5
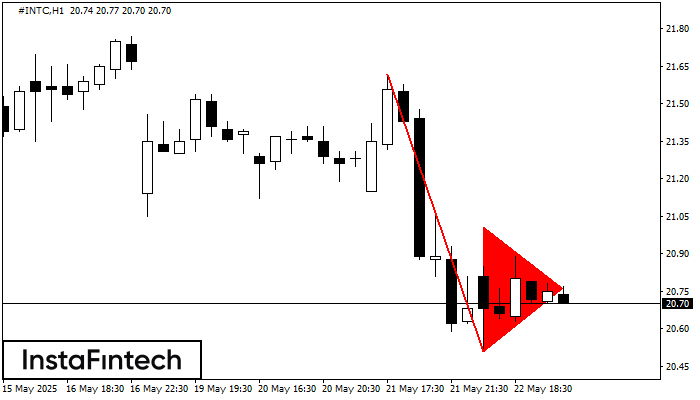
The Bearish pennant pattern has formed on the #INTC H1 chart. It signals potential continuation of the existing trend. Specifications: the pattern’s bottom has the coordinate of 20.51; the projection of the flagpole height is equal to 111 pips. In case the price breaks out the pattern’s bottom of 20.51, the downtrend is expected to continue for further level 20.11.
See Also
- All
- Double Top
- Flag
- Head and Shoulders
- Pennant
- Rectangle
- Triangle
- Triple top
- All
- #AAPL
- #AMZN
- #Bitcoin
- #EBAY
- #FB
- #GOOG
- #INTC
- #KO
- #MA
- #MCD
- #MSFT
- #NTDOY
- #PEP
- #TSLA
- #TWTR
- AUDCAD
- AUDCHF
- AUDJPY
- AUDUSD
- EURCAD
- EURCHF
- EURGBP
- EURJPY
- EURNZD
- EURRUB
- EURUSD
- GBPAUD
- GBPCHF
- GBPJPY
- GBPUSD
- GOLD
- NZDCAD
- NZDCHF
- NZDJPY
- NZDUSD
- SILVER
- USDCAD
- USDCHF
- USDJPY
- USDRUB
- All
- M5
- M15
- M30
- H1
- D1
- All
- Buy
- Sale
- All
- 1
- 2
- 3
- 4
- 5
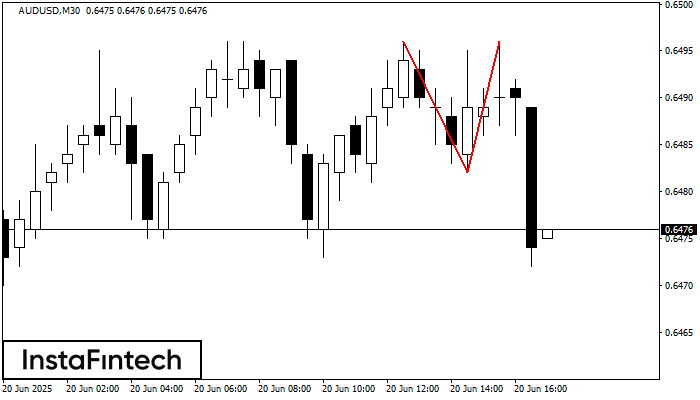
On the chart of AUDUSD M30 the Double Top reversal pattern has been formed. Characteristics: the upper boundary 0.6496; the lower boundary 0.6482; the width of the pattern 14 points
Open chart in a new window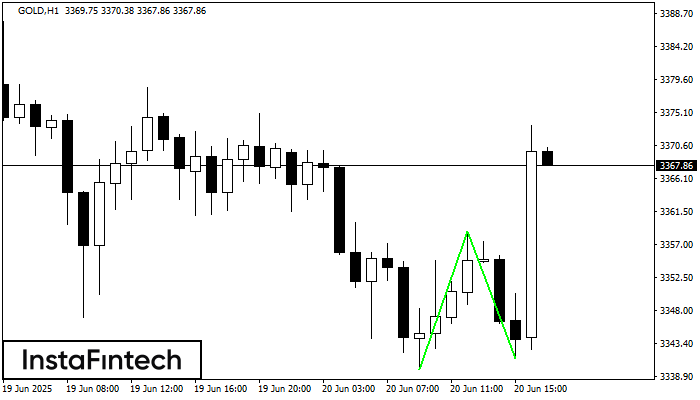
The Double Bottom pattern has been formed on GOLD H1. Characteristics: the support level 3339.89; the resistance level 3358.78; the width of the pattern 1889 points. If the resistance level
Open chart in a new window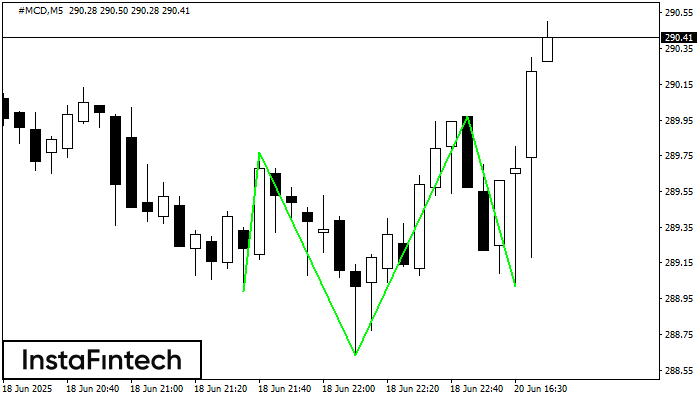
According to M5, #MCD is shaping the technical pattern – the Inverse Head and Shoulder. In case the Neckline 289.77/289.97 is broken out, the instrument is likely to move toward
The M5 and M15 time frames may have more false entry points.
Open chart in a new window