


signal strength 2 of 5
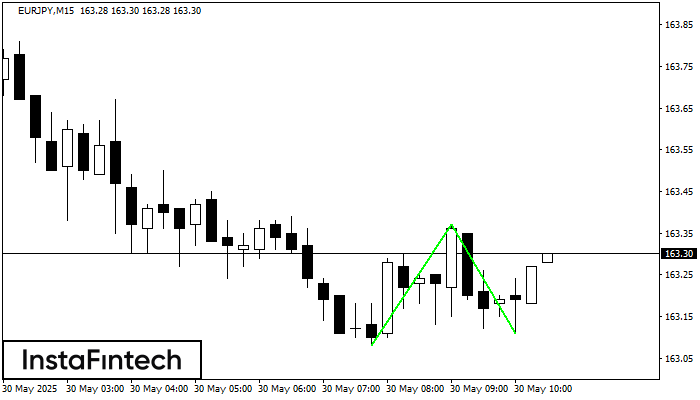
The Double Bottom pattern has been formed on EURJPY M15. Characteristics: the support level 163.08; the resistance level 163.37; the width of the pattern 29 points. If the resistance level is broken, a change in the trend can be predicted with the first target point lying at the distance of 26 points.
The M5 and M15 time frames may have more false entry points.
See Also
- All
- Double Top
- Flag
- Head and Shoulders
- Pennant
- Rectangle
- Triangle
- Triple top
- All
- #AAPL
- #AMZN
- #Bitcoin
- #EBAY
- #FB
- #GOOG
- #INTC
- #KO
- #MA
- #MCD
- #MSFT
- #NTDOY
- #PEP
- #TSLA
- #TWTR
- AUDCAD
- AUDCHF
- AUDJPY
- AUDUSD
- EURCAD
- EURCHF
- EURGBP
- EURJPY
- EURNZD
- EURRUB
- EURUSD
- GBPAUD
- GBPCHF
- GBPJPY
- GBPUSD
- GOLD
- NZDCAD
- NZDCHF
- NZDJPY
- NZDUSD
- SILVER
- USDCAD
- USDCHF
- USDJPY
- USDRUB
- All
- M5
- M15
- M30
- H1
- D1
- All
- Buy
- Sale
- All
- 1
- 2
- 3
- 4
- 5
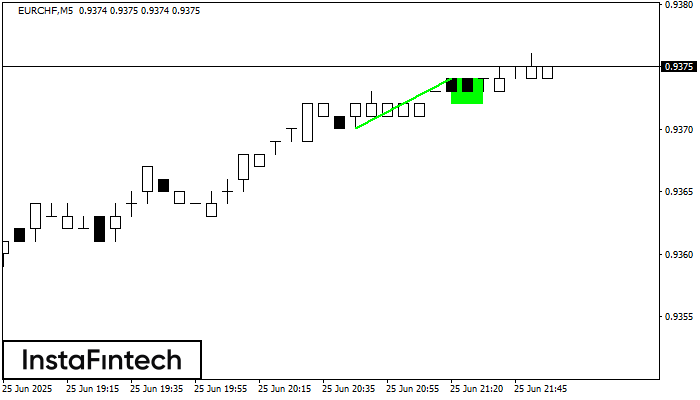
The Bullish Flag pattern has been formed on EURCHF at M5. The lower boundary of the pattern is located at 0.9372/0.9372, while the higher boundary lies at 0.9374/0.9374. The projection
The M5 and M15 time frames may have more false entry points.
Open chart in a new window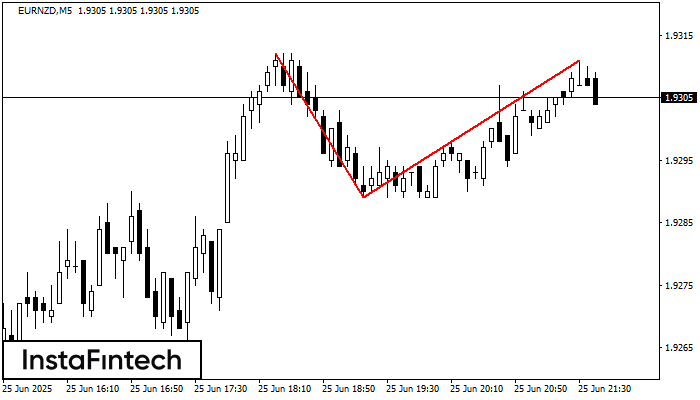
On the chart of EURNZD M5 the Double Top reversal pattern has been formed. Characteristics: the upper boundary 1.9311; the lower boundary 1.9289; the width of the pattern 22 points
The M5 and M15 time frames may have more false entry points.
Open chart in a new window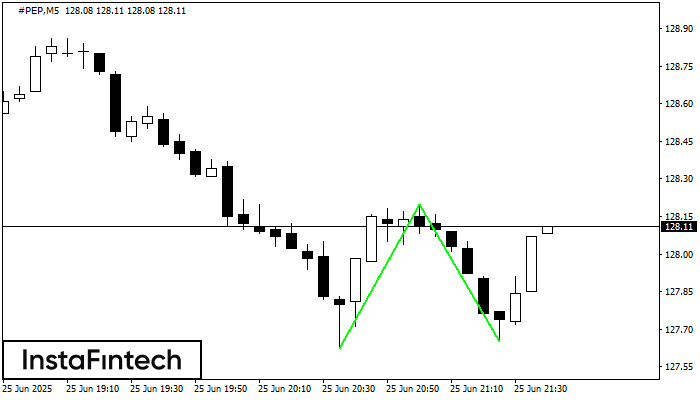
The Double Bottom pattern has been formed on #PEP M5; the upper boundary is 128.20; the lower boundary is 127.65. The width of the pattern is 58 points. In case
The M5 and M15 time frames may have more false entry points.
Open chart in a new window


