empty
13.08.2024 06:09 AM
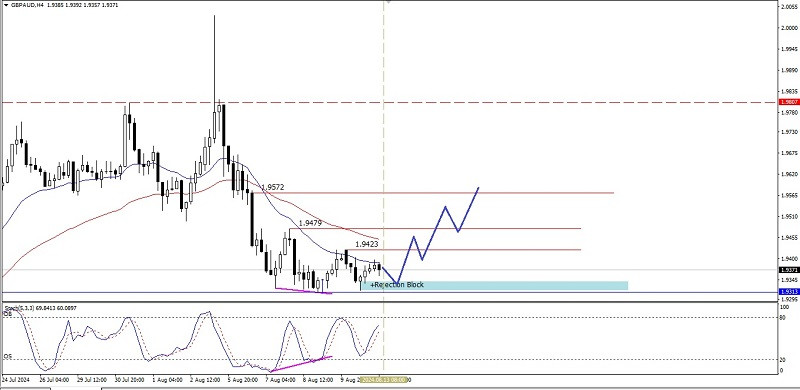
Technical Analysis of Intraday Price Movement of GBP/AUD Cross Currency Pairs, Tuesday August 13, 2024. Agustus 2024.

This image is no longer relevant

With the appearance of deviations between the price movement of the GBP/AUD cross currency pair with the Stochastic Oscillator indicator, this gives an indication that in the near future GBP/AUD has the potential to correct and strengthen from its current weakening condition, it provided that there is no continuation of the weakening that breaks below the level of 1.9313 because if this level is successfully broken below, this will be a signal of continued weakening in GBP/AUD, but if the opposite happens, GBP/AUD has the potential to continue strengthening to the level of 1.9423. If this level is successfully broken, this will be a good sign for GBP/AUD to continue strengthening to the level of 1.9479 as its main target and if the momentum and volatility support it, GBP/AUD has the potential to go to the level of 1.9572.

(Disclaimer)

Select timeframe
5
min
15
min
30
min
1
hour
4
hours
1
day
1
week
Earn on cryptocurrency rate changes with InstaForex
Download MetaTrader 4 and open your first trade
  • Grand Choice
    Contest by
    InstaForex
    InstaForex always strives to help you
    fulfill your biggest dreams.
    JOIN CONTEST

Recommended Stories

EUR/NZD Forecast for May 23, 2025

On the daily chart, the pair's quote breaks above the MACD line after spending two weeks below it. The Marlin oscillator's entry into positive territory supports the assumption

Laurie Bailey 04:43 2025-05-23 UTC+2

Trading Signals for GOLD for May 22-25, 2025: buy above $3,281 (21 SMA - 6/8 Murray)

The Eagle indicator is showing a negative signal, suggesting that gold's decline could continue in the coming days. To do this, we must pay attention to the 3,281 zone; below

Dimitrios Zappas 18:15 2025-05-22 UTC+2

Trading Signals for BITCOIN for May 22-25, 2025: sell below $111,850 (+2/8 Murray - 200 EMA)

Bitcoin reached highs above $111,850 near the +2/8 Murray area, which represents an extreme overbought zone. Bitcoin could suffer a sharp decline in the coming days and reach the bottom

Dimitrios Zappas 18:12 2025-05-22 UTC+2

Trading Signals for EUR/USD for May 22-25, 2025: sell below 1.1286 (200 EMA - 21 SMA)

EUR/USD is trading around 1.1287 after attempting to break the top of the downtrend channel. The instrument is now consolidating around the 21 SMA, which suggests it could continue

Dimitrios Zappas 18:11 2025-05-22 UTC+2

Forecast for EUR/USD on May 22, 2025

On Wednesday, the EUR/USD pair continued to rise and consolidated above the 50.0% Fibonacci retracement level at 1.1320. As a result, the euro may continue appreciating toward the next resistance

Samir Klishi 11:51 2025-05-22 UTC+2

Forecast for GBP/USD on May 22, 2025

On the hourly chart, the GBP/USD pair continued rising on Wednesday, ending the day near the 1.3425 level. Just a couple of weeks ago, there was no sign of another

Samir Klishi 11:45 2025-05-22 UTC+2

Forex forecast 22/05/2025: EUR/USD, GBP/USD, USD/JPY, Gold, Ethereum and Bitcoin

Useful links: My other articles are available in this section InstaForex course for beginners Popular Analytics Open trading account Important: The begginers in forex trading need to be very careful

Sebastian Seliga 10:52 2025-05-22 UTC+2

Bitcoin: Reaching New Highs May Stall

Bitcoin's price briefly exceeded the new all-time high of $111,000 but failed to consolidate above it. The token, along with the broader crypto market, continues to receive support from dollar

Pati Gani 09:49 2025-05-22 UTC+2

Technical Analysis of Intraday Price Movement of Nasdaq 100 Index, Thursday May 22, 2025.

With the appearance of Divergence between the Nasdaq 100 index price movement which formed a Double Top with the Stochastic Oscillator indicator plus confirmation with its price movement which moved

Arief Makmur 07:01 2025-05-22 UTC+2

Technical Analysis of Intraday Price Movement of USD/CHF Main Currency Pairs, Thursday May 22, 2025

As we can see on the 4-hour chart of USD/CHF main currency pair, some interesting information appears, namely first the appearance of Divergence between the price movement of USD/CHF with

Arief Makmur 07:01 2025-05-22 UTC+2
Can't speak right now?
Ask your question in the chat.
Widget callback
 

Dear visitor,

Your IP address shows that you are currently located in the USA. If you are a resident of the United States, you are prohibited from using the services of InstaFintech Group including online trading, online transfers, deposit/withdrawal of funds, etc.

If you think you are seeing this message by mistake and your location is not the US, kindly proceed to the website. Otherwise, you must leave the website in order to comply with government restrictions.

Why does your IP address show your location as the USA?

  • - you are using a VPN provided by a hosting company based in the United States;
  • - your IP does not have proper WHOIS records;
  • - an error occurred in the WHOIS geolocation database.

Please confirm whether you are a US resident or not by clicking the relevant button below. If you choose the wrong option, being a US resident, you will not be able to open an account with InstaForex anyway.

We are sorry for any inconvenience caused by this message.