empty
17.04.2025 06:27 AM
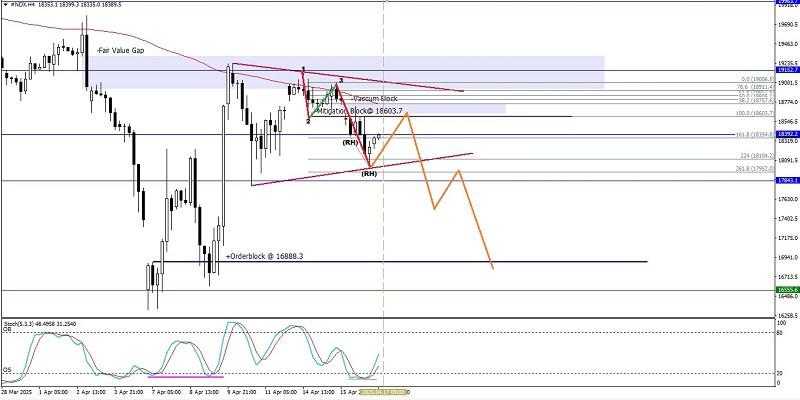
Technical Analysis of Intraday Price Movement of Nasdaq 100 Index, Thursday April 17, 2025.

This image is no longer relevant

From what we see on the 4-hour chart of the Nasdaq 100 index, there are several interesting things, namely, first, the price movement is moving below the MA (100), second, the appearance of a Triangle pattern, and third, there is a Bearish 123 pattern followed by a Bearish Ross Hook (RH). So that based on these three facts in the near future, it has the potential to weaken down where the level of 17952.0 will be tried to be tested so that if this level is successfully broken and closes below this level, #NDX has the potential to continue its weakening back to the level of 16888.3, however, if in the effort of #NDX to reach the levels that have been described previously suddenly there is a strengthening of #NDX until it breaks through and closes above 19006.5, then all the weakening scenarios that have been described previously will become invalid and canceled by themselves.

(Disclaimer)

Select timeframe
5
min
15
min
30
min
1
hour
4
hours
1
day
1
week
Earn on cryptocurrency rate changes with InstaForex
Download MetaTrader 4 and open your first trade
  • Grand Choice
    Contest by
    InstaForex
    InstaForex always strives to help you
    fulfill your biggest dreams.
    JOIN CONTEST

Recommended Stories

Forex forecast 06/06/2025: EUR/USD, USD/JPY, SP500, Oil, Ethereum and Bitcoin

Useful links: My other articles are available in this section InstaForex course for beginners Popular Analytics Open trading account Important: The begginers in forex trading need to be very careful

Sebastian Seliga 09:51 2025-06-06 UTC+2

Forecast for EUR/USD on June 6, 2025

Yesterday, the ECB as expected cut key rates by a quarter point, bringing the refinancing rate to 2.15%. At the press conference, ECB President Christine Lagarde stated that rates have

Laurie Bailey 08:21 2025-06-06 UTC+2

Forecast for GBP/USD on June 6, 2025

GBP/USD Amid yesterday's brief optimism over the ECB's decision to cut rates and nearly complete the easing cycle, the pound almost reached the target level of 1.3635. Today began neutrally

Laurie Bailey 08:17 2025-06-06 UTC+2

Forecast for USD/JPY on June 6, 2025

As of this morning, the USD/JPY pair has found itself in a completely dual situation, with an equal likelihood of both growth and decline. Indicators suggesting growth include the price

Laurie Bailey 08:13 2025-06-06 UTC+2

Trading Signals for EUR/USD for June 6-10, 2025: buy above 1.1080 (200 EMA - 6/8 Murray)

The eagle indicator is showing a negative signal, so we believe that if the euro falls below the 6/8 Murray level in the coming hours, it will be seen

Dimitrios Zappas 07:04 2025-06-06 UTC+2

Trading Signals for GOLD (XAU/USD) for June 6-10, 2025: buy above $3,365 (21 SMA - 7/8 Murray)

On the other hand, gold is expected to undergo a technical correction. On May 30, it left a gap around 3,284, and if it consolidates below 3,350, it could likely

Dimitrios Zappas 07:01 2025-06-06 UTC+2

NZD/USD. Analysis and Forecast

Today the NZD/USD pair continues to attract buyers, though it still remains below the 0.6050 level. Oscillators across all timeframes are firmly in positive territory and far from overbought zones

Irina Yanina 12:03 2025-06-05 UTC+2

Forecast for EUR/USD on June 5, 2025

On Wednesday, the EUR/USD pair rebounded from the support zone of 1.1374–1.1380 and reversed in favor of the euro. A new upward move toward the 76.4% retracement level at 1.1454

Samir Klishi 11:22 2025-06-05 UTC+2

GBP/USD. June 5th. Labor Market Sends Negative Signals

On the hourly chart, the GBP/USD pair on Wednesday consolidated above the weak 161.8% retracement level at 1.3520. This consolidation allows for expectations of continued growth toward the next retracement

Samir Klishi 11:14 2025-06-05 UTC+2

Technical Analysis of Intraday Price Movement of Nasdaq 100 Index, Thursday June 05, 2025.

With the condition of the Stochastic Oscillator indicator at the Overbought level and a Divergence appears between the indicator and the Nasdaq 100 index price movement, so that

Arief Makmur 09:53 2025-06-05 UTC+2
Can't speak right now?
Ask your question in the chat.
Widget callback
 

Dear visitor,

Your IP address shows that you are currently located in the USA. If you are a resident of the United States, you are prohibited from using the services of InstaFintech Group including online trading, online transfers, deposit/withdrawal of funds, etc.

If you think you are seeing this message by mistake and your location is not the US, kindly proceed to the website. Otherwise, you must leave the website in order to comply with government restrictions.

Why does your IP address show your location as the USA?

  • - you are using a VPN provided by a hosting company based in the United States;
  • - your IP does not have proper WHOIS records;
  • - an error occurred in the WHOIS geolocation database.

Please confirm whether you are a US resident or not by clicking the relevant button below. If you choose the wrong option, being a US resident, you will not be able to open an account with InstaForex anyway.

We are sorry for any inconvenience caused by this message.