empty
09.01.2023 03:44 PM
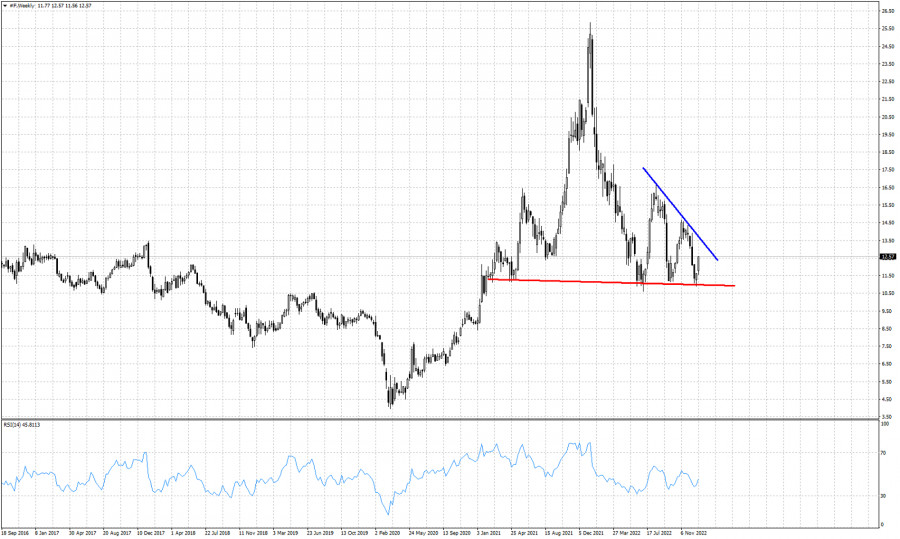
Ford stock price analysis for January 9th, 2023.

This image is no longer relevant

Blue line- resistance trend line

Red line- neckline support

Ford stock price closed last week near its weekly high around $12.57. Price continues to respect the horizontal support neck line at $11 after a third test over the last 10 months. Price has been forming lower highs after each test and bounce. Resistance now is at $13.70. This formation looks more like a bearish Head and Shoulders pattern. For the bearish pattern to provide a bearish signal we need to see price break the red horizontal support. Since support is being respected, bulls continue to have hopes for a move higher. A break above the resistance trend line at $13,70 would be a very positive sign. Currently the most probable outcome would be for price to reach the blue trend line and form another lower high.

Select timeframe
5
min
15
min
30
min
1
hour
4
hours
1
day
1
week
Earn on cryptocurrency rate changes with InstaForex
Download MetaTrader 4 and open your first trade
  • Grand Choice
    Contest by
    InstaForex
    InstaForex always strives to help you
    fulfill your biggest dreams.
    JOIN CONTEST

Recommended Stories

Nvidia Shares Reach All-Time High

Yesterday, the NASDAQ technology index closed the day in positive territory, thanks largely to the rally in Nvidia Corp. shares, which reached a historic high. The leading producer

Jakub Novak 11:06 2025-06-26 UTC+2

The Stock Market Is Approaching Dangerous Levels

The wave pattern on the 24-hour chart for the #SPX instrument appears generally clear. At this point, the formation of an upward trend segment is presumably complete. In my view

Chin Zhao 12:35 2025-06-25 UTC+2

Update on US stock market on June 25. Key stock indices growing in confidence

S&P500 Snapshot of the US major stock indexes on Tuesday: Dow +1.2%, NASDAQ +1.4%, S&P 500 +1.1% (closed at 6,092, within a 5,700–6,300 range). The stock market traded with

Jozef Kovach 11:52 2025-06-25 UTC+2

US stock market in uptrend as ceasefire announced between Israel and Iran

S&P500 Snapshot of the benchmark US stock indices on Monday: Dow +0.9%, NASDAQ +0.9%, S&P 500 +1%, S&P 500 at 6,025, range 5,600–6,200 In the early hours of June

Jozef Kovach 12:37 2025-06-24 UTC+2

Update on US stock indices on June 24. SP500 and NASDAQ surge amid good news

US stock indices closed higher yesterday. The S&P 500 rose by 0.94%, and the Nasdaq 100 also gained 0.94%. The industrial Dow Jones strengthened by 0.88%. Oil prices fell while

Jakub Novak 10:54 2025-06-24 UTC+2

S&P 500 Forecast for June 24, 2025

S&P 500 The new week began with confident growth for the S&P 500. The support from the balance line indicator (the red moving average) on the weekly timeframe worked well

Laurie Bailey 04:44 2025-06-24 UTC+2

Update on US stock market on June 23. US stock indices close mixed. Oil trades higher amid geopolitical tensions

Last Friday, US stock indices closed mixed. The S&P 500 fell by 0.22%, and the Nasdaq 100 lost 0.55%, while the industrial Dow Jones gained 0.08%. Today, futures for European

Jakub Novak 11:09 2025-06-23 UTC+2

Uptrend in US stock market about to crack. Will market maintain bullish momentum until end of summer?

The US stock market maintains an appearance of stability, but the foundation beneath this calm may prove fragile. Indices remain near historic highs. Nonetheless, a potentially explosive combination is brewing

Anna Zotova 17:09 2025-06-20 UTC+2

Update on US stock market on June 20. SP500 and NASDAQ open with gains

Yesterday, US financial markets were closed. US stock indices ended the electronic trade mixed: the S&P 500 slipped by 0.03%, the Nasdaq 100 gained 0.13%, and the Dow Jones Industrial

Jakub Novak 11:54 2025-06-20 UTC+2

S&P 500 Forecast for June 20, 2025

For the past six weeks, the price has been unsuccessful in testing the resistance of the MACD indicator line on the weekly chart. However, the recent consolidation above the 5908

Laurie Bailey 07:16 2025-06-20 UTC+2
Can't speak right now?
Ask your question in the chat.
Widget callback
 

Dear visitor,

Your IP address shows that you are currently located in the USA. If you are a resident of the United States, you are prohibited from using the services of InstaFintech Group including online trading, online transfers, deposit/withdrawal of funds, etc.

If you think you are seeing this message by mistake and your location is not the US, kindly proceed to the website. Otherwise, you must leave the website in order to comply with government restrictions.

Why does your IP address show your location as the USA?

  • - you are using a VPN provided by a hosting company based in the United States;
  • - your IP does not have proper WHOIS records;
  • - an error occurred in the WHOIS geolocation database.

Please confirm whether you are a US resident or not by clicking the relevant button below. If you choose the wrong option, being a US resident, you will not be able to open an account with InstaForex anyway.

We are sorry for any inconvenience caused by this message.