empty
08.05.2023 10:39 PM
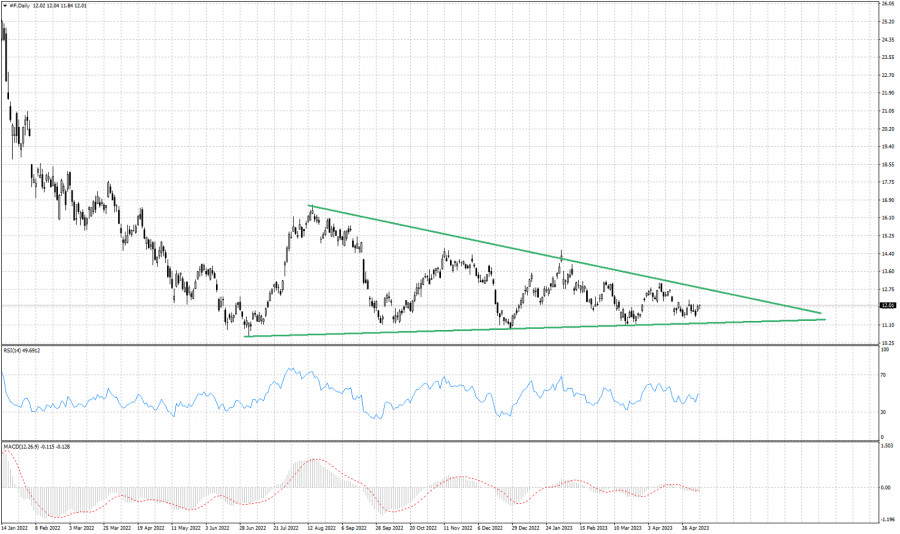
Ford stock price continues to trade inside a triangle pattern since last year.

This image is no longer relevant

Green lines- triangle pattern

Over the last 9 months, Ford's stock price has been trading in a relatively narrow range between $7.50 and $12.50. During this period, the stock has formed a triangle pattern on the daily chart, with the upper trendline connecting the highs and the lower trendline connecting the lows. The triangle pattern suggests that Ford's stock price is consolidating and that a breakout may be imminent. If the stock breaks above the upper trendline, it could signal a bullish continuation and a potential move towards the $13.50 to $14.00 range. On the other hand, if price breaks below the lower trendline, it could signal a bearish reversal and a potential move towards the $6.50 to $7.00 range. The Relative Strength Index (RSI) is currently hovering around the midpoint, indicating that the stock is neither overbought nor oversold. The Moving Average Convergence Divergence (MACD) indicator is also showing a neutral signal, with the MACD line and signal line crossing each other multiple times over the past few months. Overall, the technical outlook for Ford's stock price remains uncertain as it continues to trade within the triangle pattern. Traders and investors should keep a close eye on the upper and lower trendlines for potential breakout signals.

Select timeframe
5
min
15
min
30
min
1
hour
4
hours
1
day
1
week
Earn on cryptocurrency rate changes with InstaForex
Download MetaTrader 4 and open your first trade
  • Grand Choice
    Contest by
    InstaForex
    InstaForex always strives to help you
    fulfill your biggest dreams.
    JOIN CONTEST

Recommended Stories

Update on US stock market on May 23. Correction underway

S&P500 Correction underway on May 23 Snapshot of major US stock indexes on Thursday: Dow -1.4%, NASDAQ +0.3%, S&P 500 0%, S&P 500 at 5,842, range 5,400–6,200. Thursday's session began

Jozef Kovach 14:53 2025-05-23 UTC+2

Market approaches its peak: final surge or new pullback?

Investors are increasingly sensing cracks in the foundation beneath them. This week's approval of a large-scale fiscal package by the Trump administration with promises of tax cuts and boosted military

Anna Zotova 13:05 2025-05-23 UTC+2

S&P 500 Forecast for May 23, 2025

In the daily timeframe, the price consolidates below the green line of the ascending price channel, with a target level 5908. This likely indicates preparation to break through resistance levels

Laurie Bailey 05:16 2025-05-23 UTC+2

Update on US stock market on May 22

S&P500 Snapshot of benchmark US stock indices on Wednesday: Dow -1.9%, NASDAQ -1.4%, S&P 500 -1.6%, S&P 500 at 5,844, range 5,400–6,200. Yesterday, the stock market hit a wall

Jozef Kovach 11:06 2025-05-22 UTC+2

Stock Market Buy and Sell Recommendations – May 22, 2025

Buy Google Shares (#GOOG) Google, a multinational corporation within Alphabet Holdings, specializes in internet search, cloud computing, and advertising technologies. After the price consolidated above the 165.21 level (the

Laurie Bailey 05:06 2025-05-22 UTC+2

US market pulls back. Correction in sight?

S&P 500 Overview for May 21US market pulls back. Correction in sight? Major US indices on Tuesday: Dow -0.3%, NASDAQ -0.4%, S&P 500 -0.4%.S&P 500: 5,940, trading range: 5,400-6,200

Jozef Kovach 12:41 2025-05-21 UTC+2

Update on US stock market on May 20. Market holding gains without any correction

S&P500 Update on US stock market on May 20. Market holding gains without any correction Snapshot of benchmark US stock indices on Monday: Dow +0.3%, NASDAQ +0.0%, S&P 500 +0.1%

Jozef Kovach 11:00 2025-05-20 UTC+2

US credit rating downgrade raises odds of market correction

S&P 500 Overview for May 19 US credit rating downgrade raises odds of market correction Major US indices on Friday: Dow +0.8%, NASDAQ +0.5%, S&P 500 +0.7% S&P 500: 5,958

Jozef Kovach 12:32 2025-05-19 UTC+2

US Market: stalling below yearly highs

S&P 500 Overview for May 15 US Market: stalling below yearly highs Performance of the key US indices on Wednesday: Dow -0.2% | NASDAQ +0.7% | S&P 500 +0.1% S&P

Jozef Kovach 12:59 2025-05-15 UTC+2

Stock market buy and sell recommendations for May 15, 2025

Buying JP Morgan Chase shares (#JPM) JP Morgan Chase is an American multinational financial conglomerate. On the weekly chart, the stock has accelerated to the upside, likely aiming to reach

Laurie Bailey 12:56 2025-05-15 UTC+2
Can't speak right now?
Ask your question in the chat.
Widget callback
 

Dear visitor,

Your IP address shows that you are currently located in the USA. If you are a resident of the United States, you are prohibited from using the services of InstaFintech Group including online trading, online transfers, deposit/withdrawal of funds, etc.

If you think you are seeing this message by mistake and your location is not the US, kindly proceed to the website. Otherwise, you must leave the website in order to comply with government restrictions.

Why does your IP address show your location as the USA?

  • - you are using a VPN provided by a hosting company based in the United States;
  • - your IP does not have proper WHOIS records;
  • - an error occurred in the WHOIS geolocation database.

Please confirm whether you are a US resident or not by clicking the relevant button below. If you choose the wrong option, being a US resident, you will not be able to open an account with InstaForex anyway.

We are sorry for any inconvenience caused by this message.