GBP/USD 5-Minute Analysis
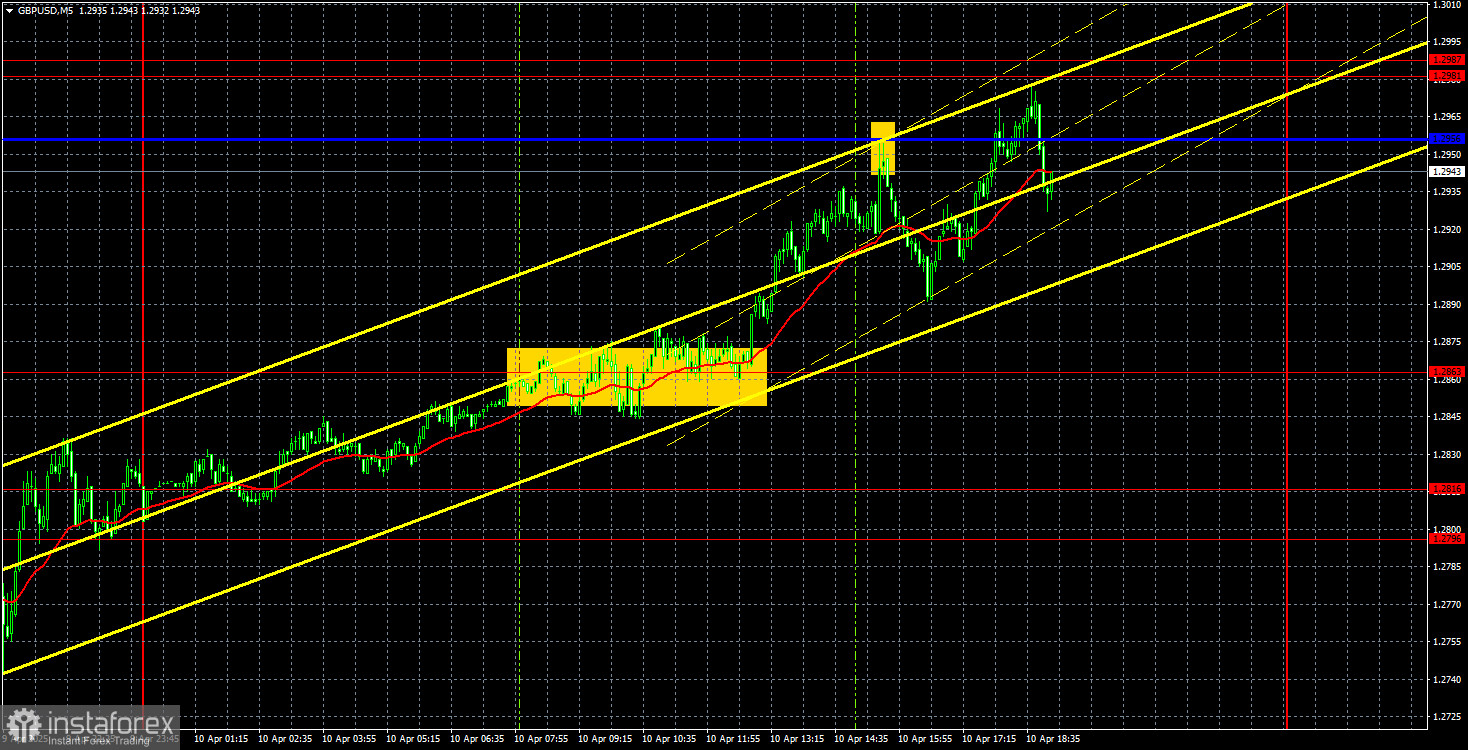
The GBP/USD currency pair also showed strong growth on Thursday, although not as strong as the EUR/USD pair. The pound gained only around 200 pips—which isn't a considerable move under current conditions. The British currency, which had long impressed with its resilience against the dollar, is now rising more slowly than the euro. And that's surprising. But let's not dwell on details.
As we mentioned yesterday, Donald Trump raised tariffs on China to 145% and simultaneously lowered them for all other countries to 10% for 90 days. The second piece of news went largely unnoticed, while the market reacted enthusiastically to the first. In addition, a U.S. inflation report for March was released, showing a sharper-than-expected decline—further weakening the dollar. Since inflation is falling, the Federal Reserve could, in theory, resume monetary easing. Of course, we don't believe this will happen in practice, but formally, it gave the market another reason to sell the dollar. As a result, the U.S. currency fell all day long.
From a technical standpoint, there's still nothing concrete to say. The pair is swinging repeatedly, and any dollar strength is surprising. No clear trendlines or channels can be formed on the hourly chart. The pair is moving solely under the influence of trade war headlines.
While excellent buy signals were formed for the euro, the pound can't boast the same. A very weak buy signal appeared during the European trading session around 1.2863, but we wouldn't have acted on it. There was also a bounce from the Kijun-sen line, but who's buying dollars when it's dropping nearly every day? That signal wasn't a loss, but you couldn't profit.
COT Report
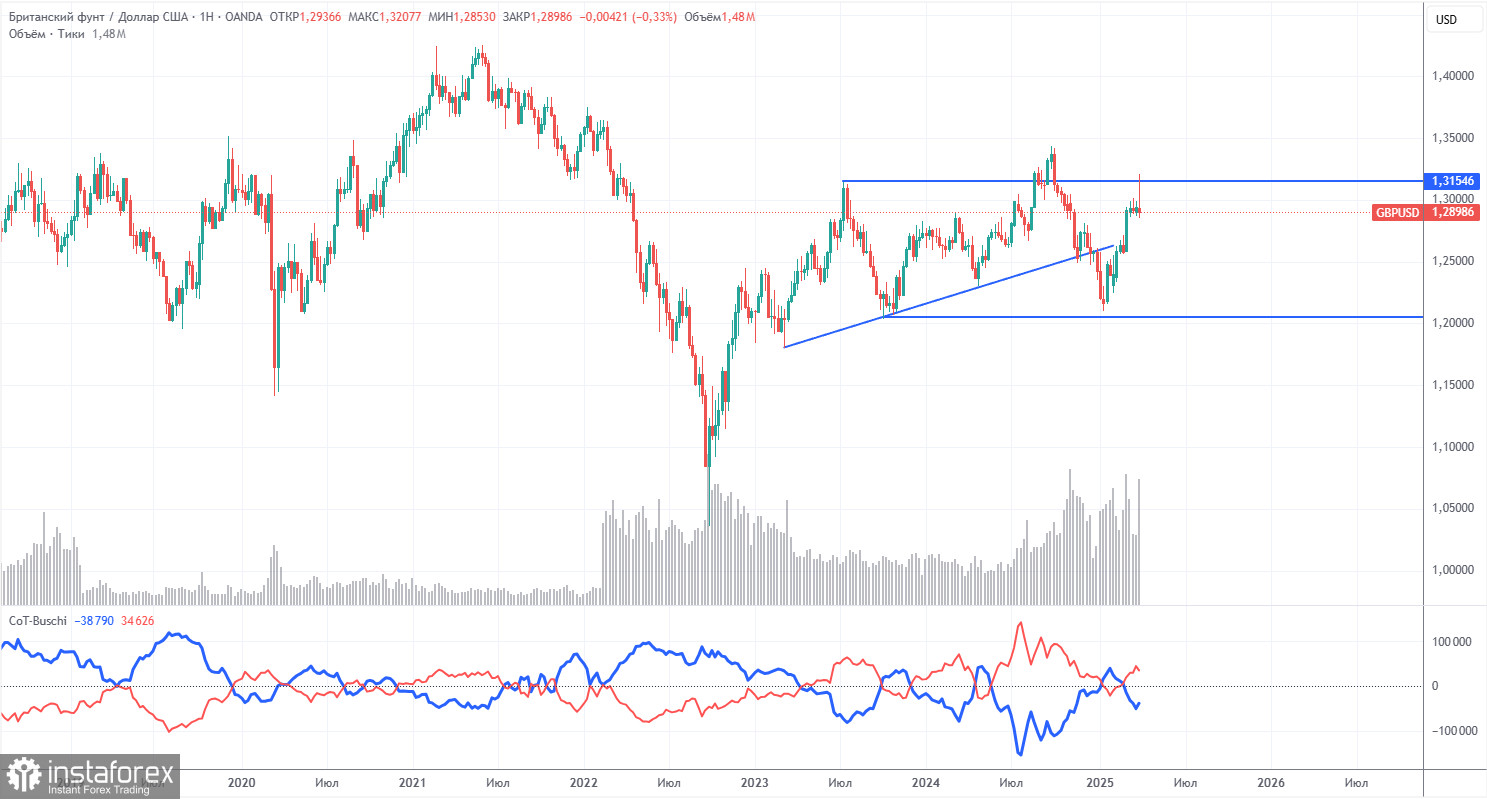
COT reports for the British pound show that sentiment among commercial traders has been constantly shifting in recent years. The red and blue lines, which represent the net positions of commercial and non-commercial traders, frequently cross and mostly hover around the zero line. At present, they remain close together, indicating a relatively balanced number of long and short positions.
On the weekly timeframe, the price first broke through the 1.3154 level, then overcame the trend line, returned to 1.3154, and bounced off it. Breaking the trend line suggests a high probability that the pound's decline will continue. The bounce from 1.3154 increases the likelihood of this scenario. Once again, the weekly chart looks as though the pound is preparing to move south.
According to the latest report on the British pound, the "Non-commercial" group closed 4,000 long contracts and opened 5,600 short contracts. As a result, the net position of non-commercial traders fell by 9,600 contracts.
The fundamental backdrop still provides no basis for long-term buying of the British pound, and the currency itself still has real potential to continue the global downtrend. The recent rally in the pound was driven by one factor alone — Donald Trump's policy.
GBP/USD 1-Hour Analysis
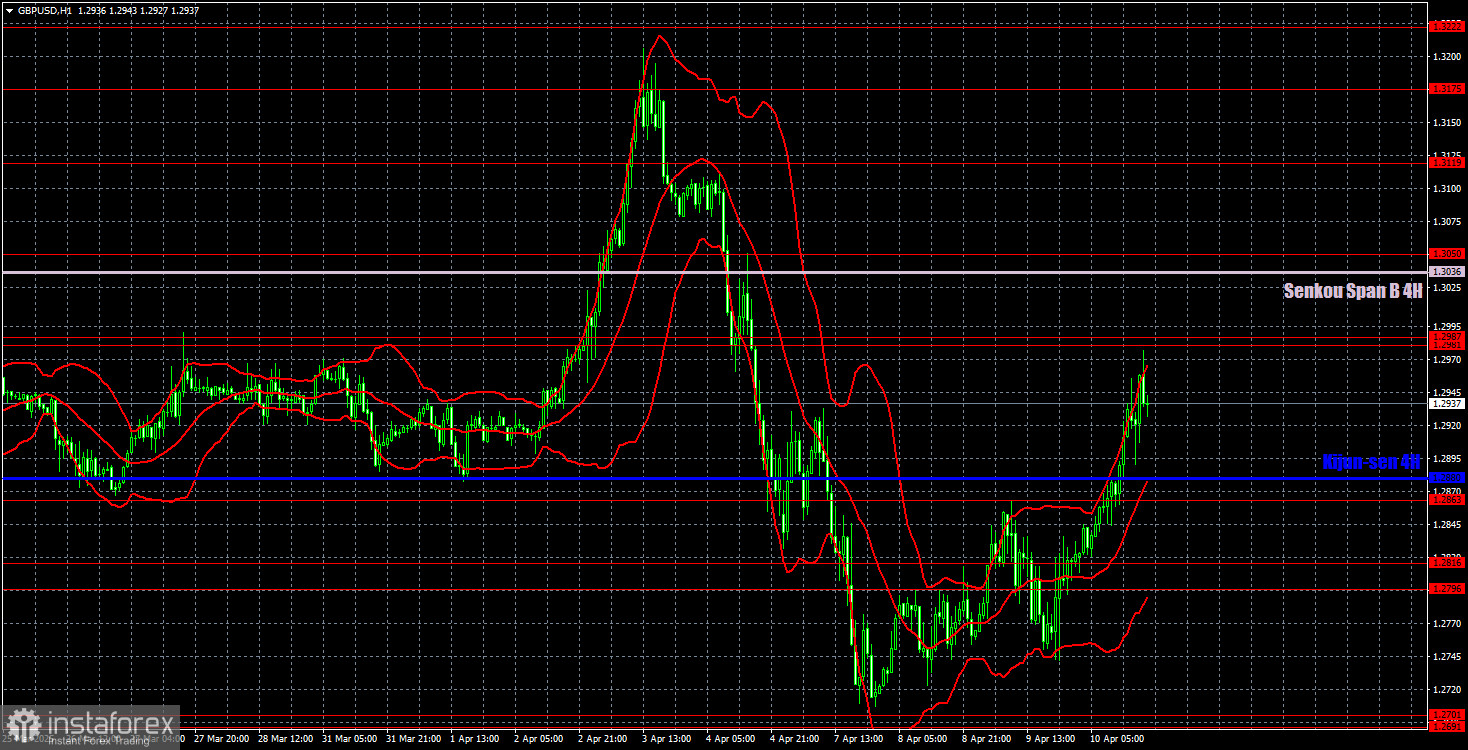
On the hourly timeframe, the GBP/USD pair showed a sharp rally after nearly a month of flat movement, followed by an even sharper decline. The pound is rising again now, but it has no merit in this move. The pound's upward trajectory is entirely the result of the dollar's decline, triggered by Donald Trump. Chaos, confusion, and panic continue to dominate the market, which should be considered when opening any positions.
Key levels for trading on April 11: 1.2511, 1.2605–1.2620, 1.2691–1.2701, 1.2796–1.2816, 1.2863, 1.2981–1.2987, 1.3050, 1.3119, 1.3175, 1.3222, 1.3273, 1.3358. Also, watch Senkou Span B (1.3036) and Kijun-sen (1.2880) as potential signal levels. A Stop Loss should be moved to breakeven once the price moves 20 pips in the desired direction. Remember that Ichimoku lines may shift throughout the day, which should be considered when identifying trade signals.
On Friday, the UK will publish February GDP and industrial production data. In the U.S., we'll get the PCE index and the University of Michigan consumer sentiment index. Christine Lagarde is also scheduled to speak, and her remarks could be the day's most significant event—aside from any news related to the trade war.
Illustration Explanations:
- Support and Resistance Levels (thick red lines): Thick red lines indicate where movement may come to an end. Please note that these lines are not sources of trading signals.
- Kijun-sen and Senkou Span B Lines: Ichimoku indicator lines transferred from the 4-hour timeframe to the hourly timeframe. These are strong lines.
- Extreme Levels (thin red lines): Thin red lines where the price has previously bounced. These serve as sources of trading signals.
- Yellow Lines: Trendlines, trend channels, or any other technical patterns.
- Indicator 1 on COT Charts: Represents the net position size for each category of traders.