empty
14.07.2025 04:33 AM
Trading Recommendations and Trade Breakdown for EUR/USD on July 14. The Dollar Is Tired

EUR/USD 5M Analysis

This image is no longer relevant

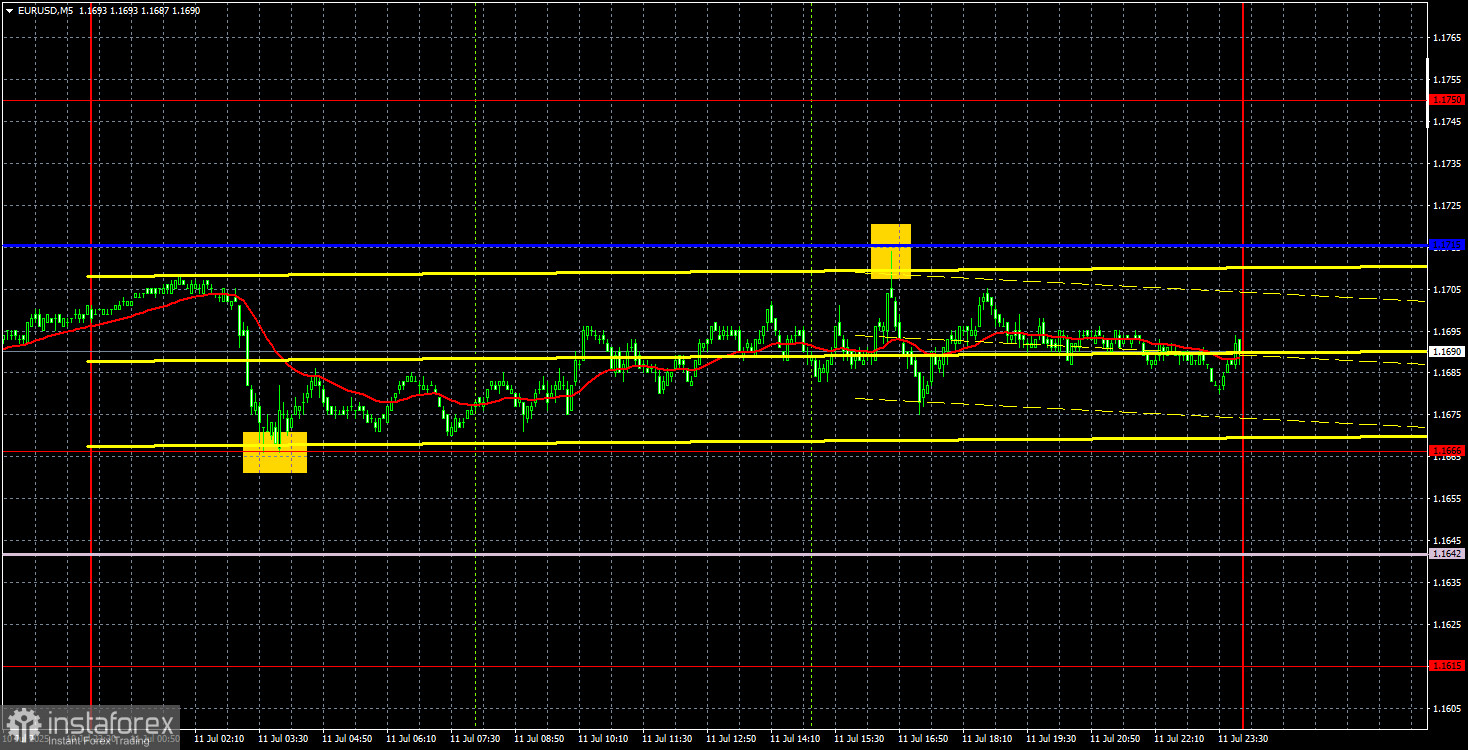
The EUR/USD currency pair showed virtually no decline throughout Friday. As we warned in the previous article, the 1.1666 level is a strong one, and it would be difficult for the U.S. currency to overcome it. Market volatility is currently quite low, which once again points to the weakness of the bears. Simply put, the dollar is correcting purely on technical grounds. No one in the market is eager to buy it for the medium term.

There was no macroeconomic background on Friday, and among fundamental developments, we can only note Donald Trump's announcement of increased tariffs for Canada. Such news no longer causes shock or panic, as the market has long grown accustomed to it. However, one should remember that this remains a negative factor for the U.S. currency. The fact that it is not falling at the moment does not cancel out the possibility of a market reaction to a new round of trade war escalation in the future. The pair may continue correcting for some time, and then begin a new upward movement, which will be a delayed reaction to all the news of the previous week. Identifying the end of the correction will be fairly easy—a breakout above the descending channel.

On Friday, the price traded sideways. Two trading signals were generated during the day. At night, the 1.1666 level was tested again, and the price then rose to the Kijun-sen line, which itself was moving toward the price during the day. Since at the time the European session opened, the price was only a few points away from the entry signal, long positions could be confidently opened. A rebound from the critical line triggered a small decline, and traders could also have opened a short position.
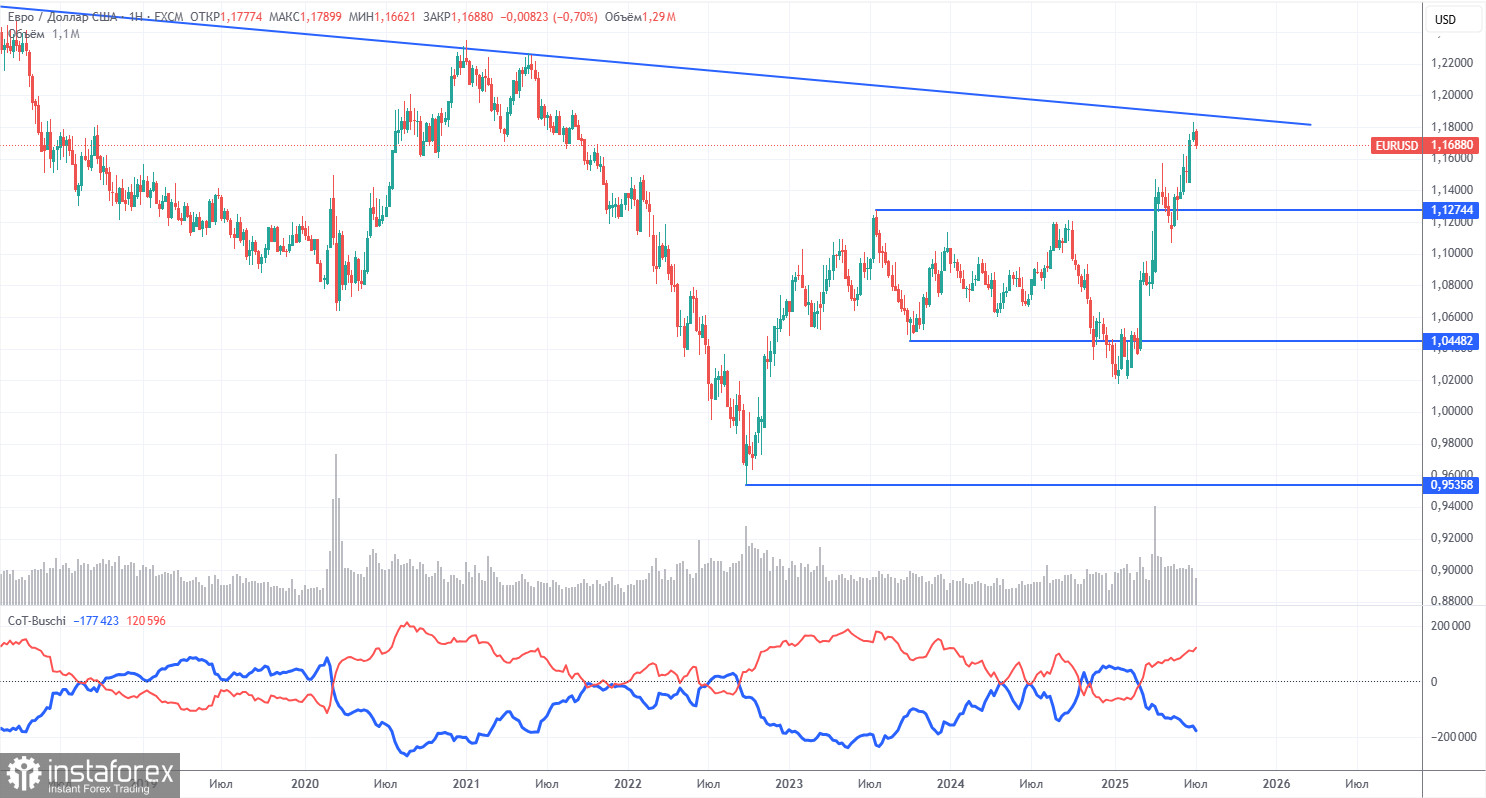
COT Report

This image is no longer relevant

The latest COT report is dated July 8. As shown clearly in the illustration above, the net position of non-commercial traders had long remained "bullish." Bears only briefly gained the upper hand at the end of 2024 but quickly lost it. Since Trump took office as U.S. president, only the dollar has been falling. We cannot say with 100% certainty that the U.S. currency will continue to decline, but the current developments in the world suggest just that.

We still see no fundamental drivers for the euro's strengthening, but there remains one strong factor contributing to the dollar's decline. The global downtrend persists, but does it matter where the price moved over the last 16 years? As soon as Trump ends his trade wars, the dollar might begin to rise again—but will Trump end them? And when?

Currently, the red and blue lines have crossed again, so the trend in the market remains bullish. During the last reporting week, the number of long positions in the "Non-commercial" group increased by 16,100, while short positions increased by 3,100. Thus, the net position grew by 13,000 contracts over the week.

EUR/USD 1H Analysis

This image is no longer relevant

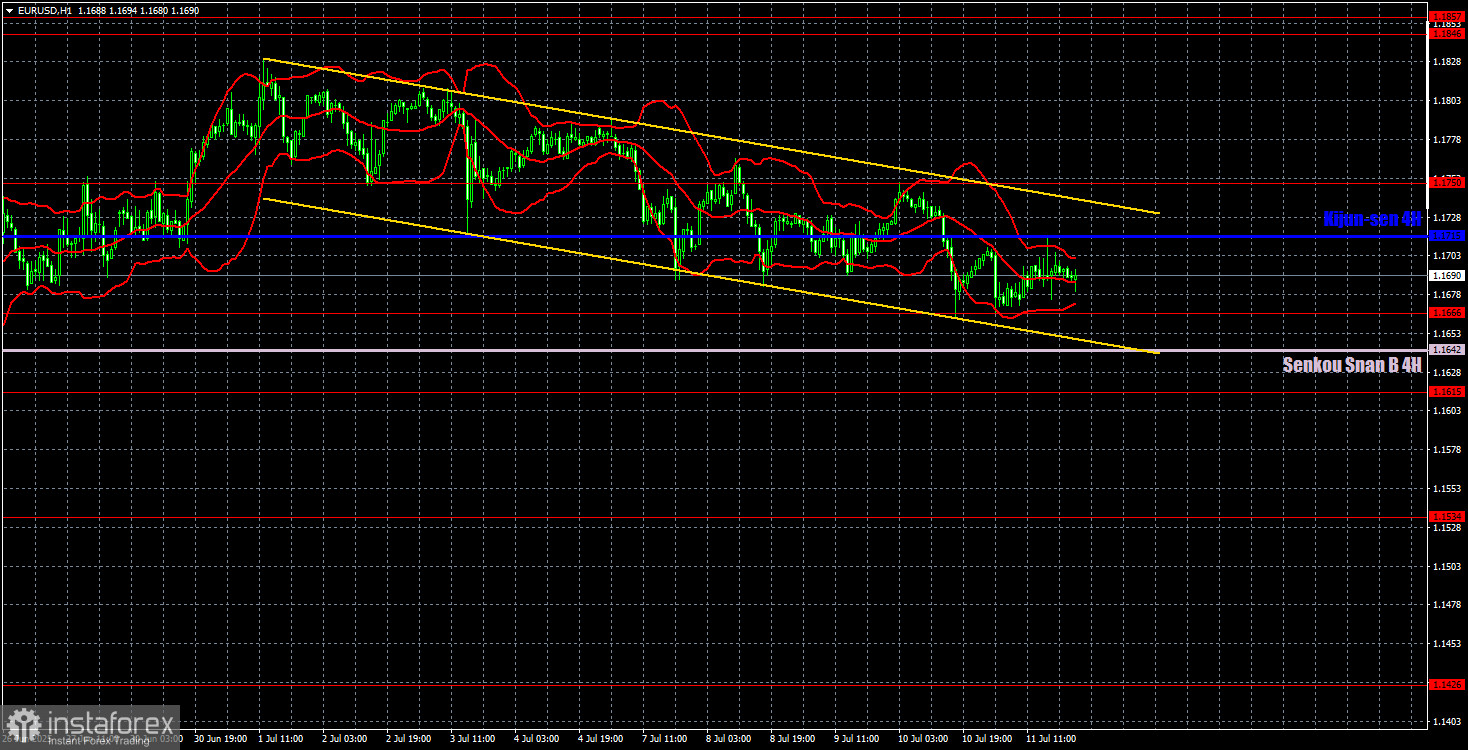
On the hourly timeframe, the EUR/USD pair maintains a downward trend supported by a descending channel. Thus, the dollar may continue to appreciate in a convulsive fashion for some time, but its fate now seems sealed. Trump continues to announce new tariffs, trade deals are not being signed, and the dollar is showing purely corrective growth. Therefore, we believe that the current fundamental background, just like before, does not support the dollar.

For July 14, we highlight the following levels for trading: 1.1092, 1.1147, 1.1185, 1.1234, 1.1274, 1.1362, 1.1426, 1.1534, 1.1615, 1.1666, 1.1750, 1.1846–1.1857, as well as the Senkou Span B line (1.1642) and the Kijun-sen line (1.1715). The Ichimoku indicator lines may move throughout the day, so this must be taken into account when identifying trading signals. Don't forget to set the Stop Loss to breakeven if the price moves 15 points in the right direction. This will protect you from potential losses if the signal turns out to be false.

On Monday, there are no important events or reports scheduled in either the Eurozone or the U.S. We believe there is a high chance of another rebound from the 1.1666 level today, so traders should prepare for a potential reversal. A breakout below 1.1666 should not be viewed as a sell signal, as a strong Senkou Span B line lies just below it.

Explanations for the illustrations:

  • Support and resistance price levels – thick red lines near which price movement may stop. These are not sources of trading signals.
  • Kijun-sen and Senkou Span B lines – Ichimoku indicator lines transferred to the hourly timeframe from the 4-hour chart. These are strong lines.
  • Extreme levels – thin red lines from which the price previously rebounded. These serve as sources of trading signals.
  • Yellow lines – trend lines, trend channels, and other technical patterns.
  • COT chart indicator 1 – the size of the net position of each trader category.
Paolo Greco,
Analytical expert of InstaForex
© 2007-2025
Summary
Urgency
Analytic
Stanislav Polyanskiy
Start trade
Earn on cryptocurrency rate changes with InstaForex
Download MetaTrader 4 and open your first trade
  • Grand Choice
    Contest by
    InstaForex
    InstaForex always strives to help you
    fulfill your biggest dreams.
    JOIN CONTEST

Recommended Stories

How to Trade the GBP/USD Pair on August 21? Simple Tips and Trade Analysis for Beginners

Analysis of Wednesday's Trades 1H Chart of GBP/USD On Wednesday, the GBP/USD pair continued a weak downward movement, which is based purely on technical factors. While there was no macroeconomic

Paolo Greco 07:35 2025-08-21 UTC+2

How to Trade the EUR/USD Pair on August 21? Simple Tips and Trade Analysis for Beginners

Analysis of Wednesday's Trades 1H Chart of EUR/USD On Wednesday, the EUR/USD currency pair continued to move with minimal volatility and without a clear direction. More precisely, there

Paolo Greco 07:35 2025-08-21 UTC+2

Trading Recommendations and Trade Breakdown for GBP/USD on August 21: The Pound Continues to Correct

On Wednesday, the GBP/USD pair continued a weak downward move, which has a corrective character. The price consolidated below the ascending trendline, so the decline was expected. A decline

Paolo Greco 04:16 2025-08-21 UTC+2

Trading Recommendations and Trade Breakdown for EUR/USD on August 21: Flat Continues

The EUR/USD pair on Wednesday continued trading within the same flat range as in the previous days. Volatility is shrinking day by day, so now the working range is limited

Paolo Greco 04:16 2025-08-21 UTC+2

How to Trade the GBP/USD Pair on August 20? Simple Tips and Trade Analysis for Beginners

Analysis of Tuesday's Trades 1H Chart of GBP/USD On Tuesday, the GBP/USD pair traded with a slight decline, which was not triggered by any events or reports. The ascending trendline

Paolo Greco 06:59 2025-08-20 UTC+2

How to Trade the EUR/USD Pair on August 20? Simple Tips and Trade Analysis for Beginners

Analysis of Tuesday's Trades 1H Chart of EUR/USD On Tuesday, the EUR/USD pair traded intraday in both directions with minimal volatility. The macroeconomic and fundamental background remains absent, leaving

Paolo Greco 06:59 2025-08-20 UTC+2

Trading Recommendations and Trade Breakdown for EUR/USD on August 20: A Total, News-Free Flat

The EUR/USD currency pair continued to trade on Tuesday with minimal volatility, without support from macroeconomic or fundamental background, and strictly sideways. As we expected, the U.S. construction sector reports

Paolo Greco 03:38 2025-08-20 UTC+2

Trading Recommendations and Trade Breakdown for GBP/USD on August 20: The Pound Slips Down Weakly

The GBP/USD currency pair on Tuesday generally maintained the downward tendency of recent days. Unlike EUR/USD, GBP/USD is showing at least some movement. Naturally, this movement is corrective. A consolidation

Paolo Greco 03:38 2025-08-20 UTC+2

How to Trade the GBP/USD Pair on August 19? Simple Tips and Trade Analysis for Beginners

Analysis of Monday's Trades 1H Chart of GBP/USD On Monday, the GBP/USD pair also traded lower and broke through its ascending trendline. After two weeks of growth, a technical correction

Paolo Greco 07:03 2025-08-19 UTC+2

How to Trade the EUR/USD Pair on August 19? Simple Tips and Trade Analysis for Beginners

Analysis of Monday's Trades 1H Chart of EUR/USD On Monday, the EUR/USD currency pair began a new wave of decline, which had nothing to do with fundamentals or macroeconomics. During

Paolo Greco 07:03 2025-08-19 UTC+2
Can't speak right now?
Ask your question in the chat.
Widget callback
 

Dear visitor,

Your IP address shows that you are currently located in the USA. If you are a resident of the United States, you are prohibited from using the services of InstaFintech Group including online trading, online transfers, deposit/withdrawal of funds, etc.

If you think you are seeing this message by mistake and your location is not the US, kindly proceed to the website. Otherwise, you must leave the website in order to comply with government restrictions.

Why does your IP address show your location as the USA?

  • - you are using a VPN provided by a hosting company based in the United States;
  • - your IP does not have proper WHOIS records;
  • - an error occurred in the WHOIS geolocation database.

Please confirm whether you are a US resident or not by clicking the relevant button below. If you choose the wrong option, being a US resident, you will not be able to open an account with InstaForex anyway.

We are sorry for any inconvenience caused by this message.