signal strength 1 of 5

According to the chart of M5, GBPAUD formed the Bullish Symmetrical Triangle pattern, which signals the trend will continue. Description. The upper border of the pattern touches the coordinates 2.0988/2.0939 whereas the lower border goes across 2.0903/2.0939. The pattern width is measured on the chart at 85 pips. If the Bullish Symmetrical Triangle pattern is in progress during the upward trend, this indicates the current trend will go on. In case 2.0939 is broken, the price could continue its move toward 2.0954.
The M5 and M15 time frames may have more false entry points.
See Also
- All
- Double Top
- Flag
- Head and Shoulders
- Pennant
- Rectangle
- Triangle
- Triple top
- All
- #AAPL
- #AMZN
- #Bitcoin
- #EBAY
- #FB
- #GOOG
- #INTC
- #KO
- #MA
- #MCD
- #MSFT
- #NTDOY
- #PEP
- #TSLA
- #TWTR
- AUDCAD
- AUDCHF
- AUDJPY
- AUDUSD
- EURCAD
- EURCHF
- EURGBP
- EURJPY
- EURNZD
- EURRUB
- EURUSD
- GBPAUD
- GBPCHF
- GBPJPY
- GBPUSD
- GOLD
- NZDCAD
- NZDCHF
- NZDJPY
- NZDUSD
- SILVER
- USDCAD
- USDCHF
- USDJPY
- USDRUB
- All
- M5
- M15
- M30
- H1
- D1
- All
- Buy
- Sale
- All
- 1
- 2
- 3
- 4
- 5
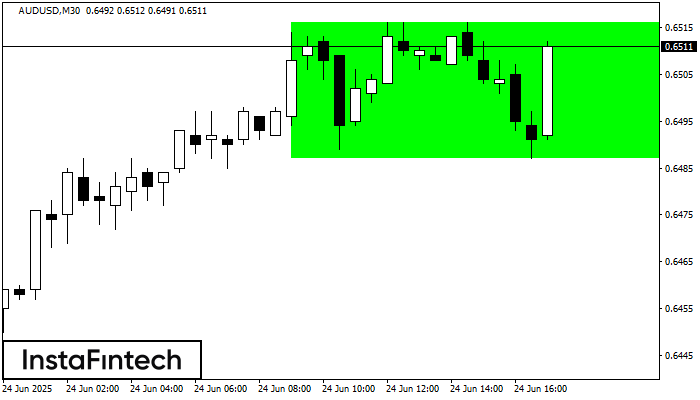
According to the chart of M30, AUDUSD formed the Bullish Rectangle. This type of a pattern indicates a trend continuation. It consists of two levels: resistance 0.6516 and support 0.6487
Open chart in a new window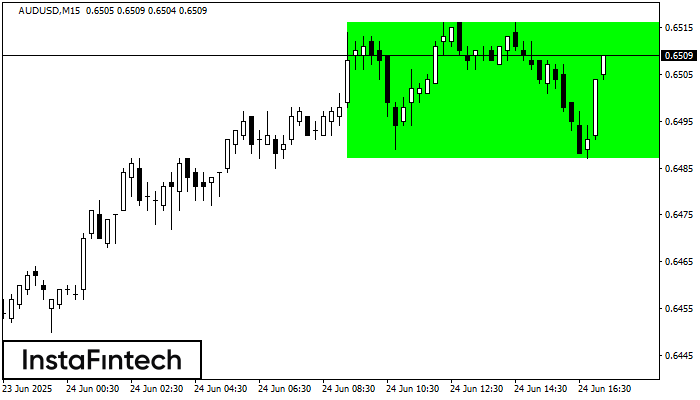
According to the chart of M15, AUDUSD formed the Bullish Rectangle. This type of a pattern indicates a trend continuation. It consists of two levels: resistance 0.6516 and support 0.6487
The M5 and M15 time frames may have more false entry points.
Open chart in a new window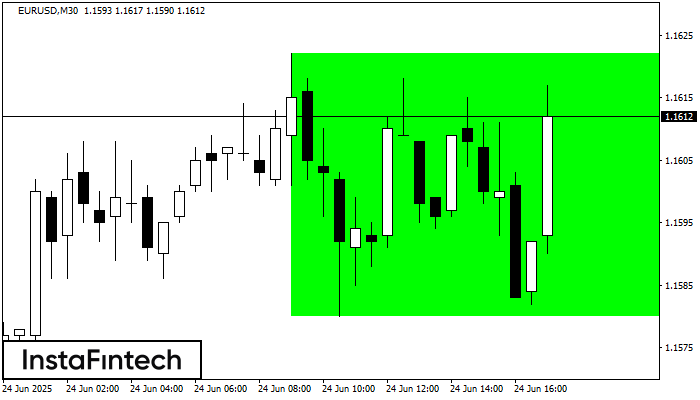
According to the chart of M30, EURUSD formed the Bullish Rectangle which is a pattern of a trend continuation. The pattern is contained within the following borders: the lower border
Open chart in a new window