signal strength 1 of 5
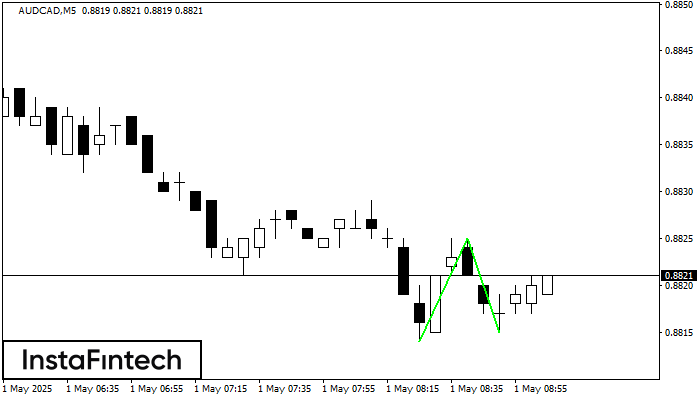
The Double Bottom pattern has been formed on AUDCAD M5. Characteristics: the support level 0.8814; the resistance level 0.8825; the width of the pattern 11 points. If the resistance level is broken, a change in the trend can be predicted with the first target point lying at the distance of 10 points.
The M5 and M15 time frames may have more false entry points.
See Also
- All
- Double Top
- Flag
- Head and Shoulders
- Pennant
- Rectangle
- Triangle
- Triple top
- All
- #AAPL
- #AMZN
- #Bitcoin
- #EBAY
- #FB
- #GOOG
- #INTC
- #KO
- #MA
- #MCD
- #MSFT
- #NTDOY
- #PEP
- #TSLA
- #TWTR
- AUDCAD
- AUDCHF
- AUDJPY
- AUDUSD
- EURCAD
- EURCHF
- EURGBP
- EURJPY
- EURNZD
- EURRUB
- EURUSD
- GBPAUD
- GBPCHF
- GBPJPY
- GBPUSD
- GOLD
- NZDCAD
- NZDCHF
- NZDJPY
- NZDUSD
- SILVER
- USDCAD
- USDCHF
- USDJPY
- USDRUB
- All
- M5
- M15
- M30
- H1
- D1
- All
- Buy
- Sale
- All
- 1
- 2
- 3
- 4
- 5
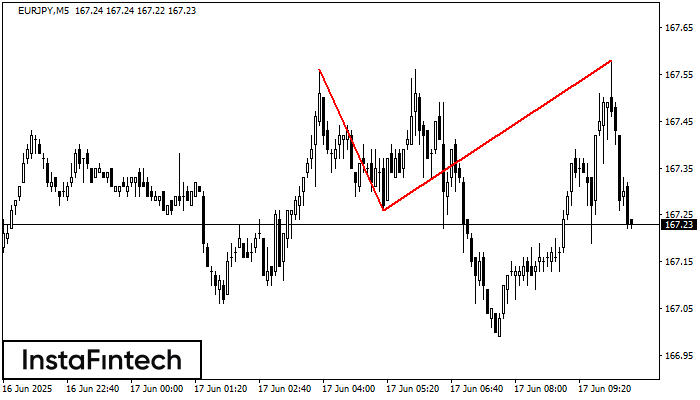
The Double Top reversal pattern has been formed on EURJPY M5. Characteristics: the upper boundary 167.56; the lower boundary 167.26; the width of the pattern is 32 points. Sell trades
The M5 and M15 time frames may have more false entry points.
Open chart in a new window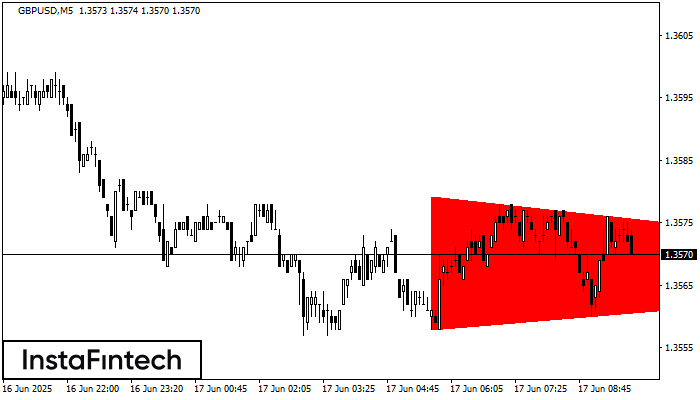
According to the chart of M5, GBPUSD formed the Bearish Symmetrical Triangle pattern. This pattern signals a further downward trend in case the lower border 1.3558 is breached. Here
The M5 and M15 time frames may have more false entry points.
Open chart in a new window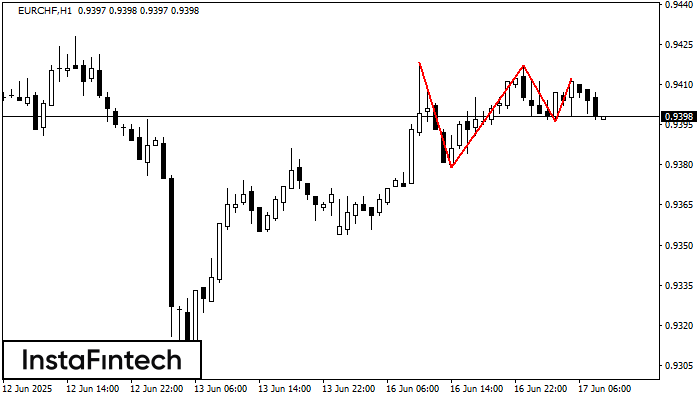
The Triple Top pattern has formed on the chart of the EURCHF H1. Features of the pattern: borders have an ascending angle; the lower line of the pattern
Open chart in a new window