


signal strength 1 of 5
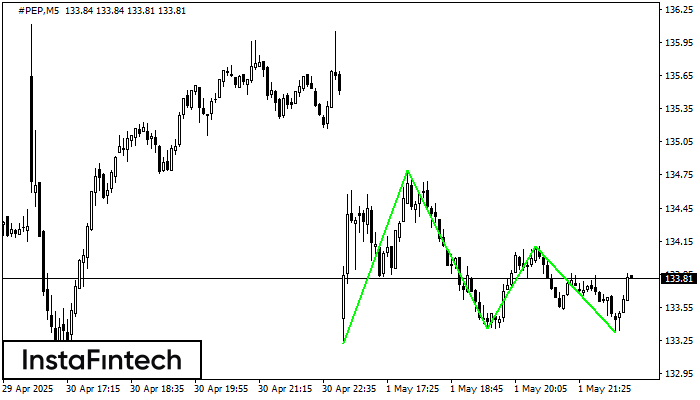
The Triple Bottom pattern has been formed on #PEP M5. It has the following characteristics: resistance level 134.79/134.10; support level 133.22/133.32; the width is 157 points. In the event of a breakdown of the resistance level of 134.79, the price is likely to continue an upward movement at least to 133.51.
The M5 and M15 time frames may have more false entry points.
- All
- Double Top
- Flag
- Head and Shoulders
- Pennant
- Rectangle
- Triangle
- Triple top
- All
- #AAPL
- #AMZN
- #Bitcoin
- #EBAY
- #FB
- #GOOG
- #INTC
- #KO
- #MA
- #MCD
- #MSFT
- #NTDOY
- #PEP
- #TSLA
- #TWTR
- AUDCAD
- AUDCHF
- AUDJPY
- AUDUSD
- EURCAD
- EURCHF
- EURGBP
- EURJPY
- EURNZD
- EURRUB
- EURUSD
- GBPAUD
- GBPCHF
- GBPJPY
- GBPUSD
- GOLD
- NZDCAD
- NZDCHF
- NZDJPY
- NZDUSD
- SILVER
- USDCAD
- USDCHF
- USDJPY
- USDRUB
- All
- M5
- M15
- M30
- H1
- D1
- All
- Buy
- Sale
- All
- 1
- 2
- 3
- 4
- 5
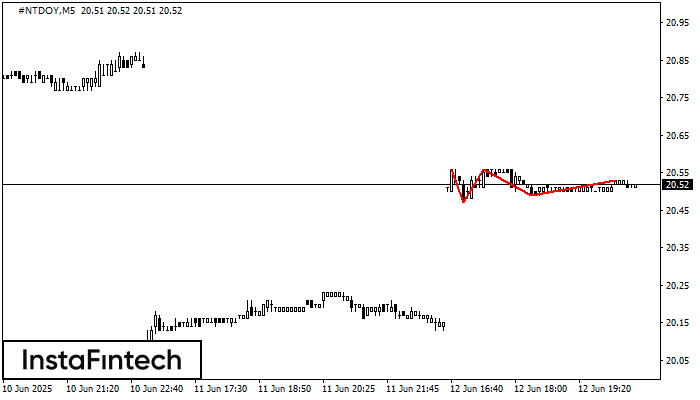
The Triple Top pattern has formed on the chart of the #NTDOY M5 trading instrument. It is a reversal pattern featuring the following characteristics: resistance level 3, support level -2
The M5 and M15 time frames may have more false entry points.
Open chart in a new window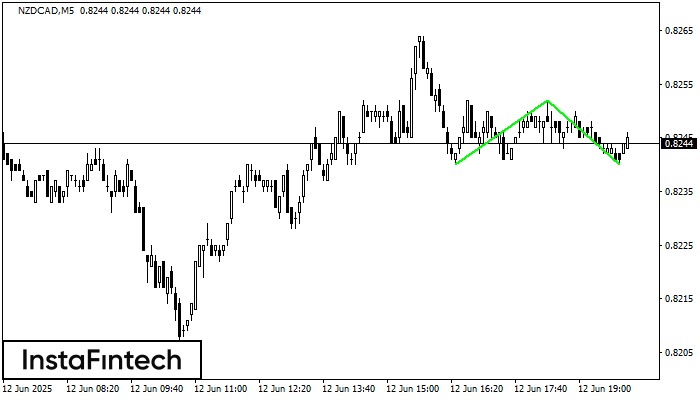
The Double Bottom pattern has been formed on NZDCAD M5; the upper boundary is 0.8252; the lower boundary is 0.8240. The width of the pattern is 12 points. In case
The M5 and M15 time frames may have more false entry points.
Open chart in a new window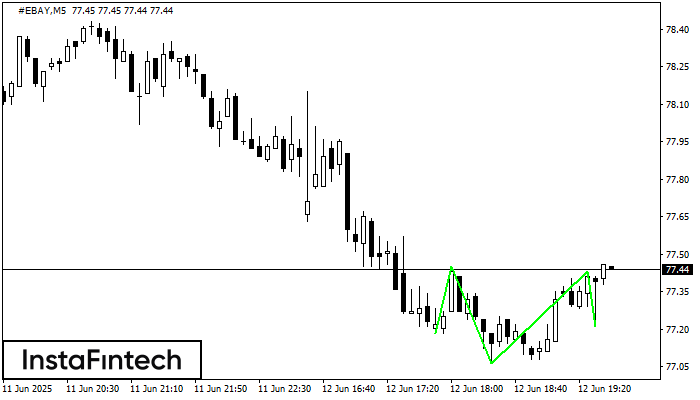
According to the chart of M5, #EBAY produced the pattern termed the Inverse Head and Shoulder. The Head is fixed at 77.06 while the median line of the Neck
The M5 and M15 time frames may have more false entry points.
Open chart in a new window


