signal strength 1 of 5
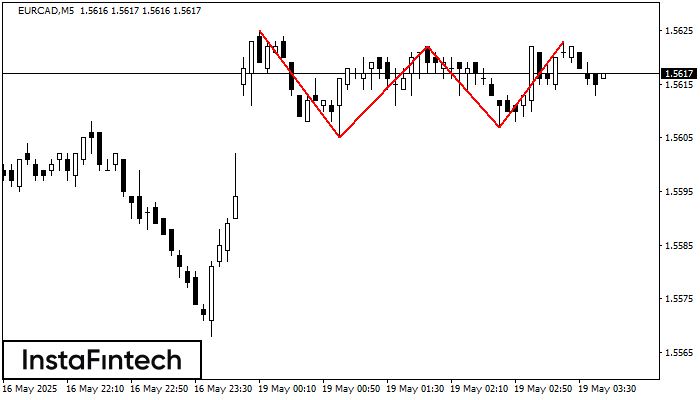
The Triple Top pattern has formed on the chart of the EURCAD M5 trading instrument. It is a reversal pattern featuring the following characteristics: resistance level 2, support level -2, and pattern’s width 20. Forecast If the price breaks through the support level 1.5605, it is likely to move further down to 1.5607.
The M5 and M15 time frames may have more false entry points.
- All
- Double Top
- Flag
- Head and Shoulders
- Pennant
- Rectangle
- Triangle
- Triple top
- All
- #AAPL
- #AMZN
- #Bitcoin
- #EBAY
- #FB
- #GOOG
- #INTC
- #KO
- #MA
- #MCD
- #MSFT
- #NTDOY
- #PEP
- #TSLA
- #TWTR
- AUDCAD
- AUDCHF
- AUDJPY
- AUDUSD
- EURCAD
- EURCHF
- EURGBP
- EURJPY
- EURNZD
- EURRUB
- EURUSD
- GBPAUD
- GBPCHF
- GBPJPY
- GBPUSD
- GOLD
- NZDCAD
- NZDCHF
- NZDJPY
- NZDUSD
- SILVER
- USDCAD
- USDCHF
- USDJPY
- USDRUB
- All
- M5
- M15
- M30
- H1
- D1
- All
- Buy
- Sale
- All
- 1
- 2
- 3
- 4
- 5
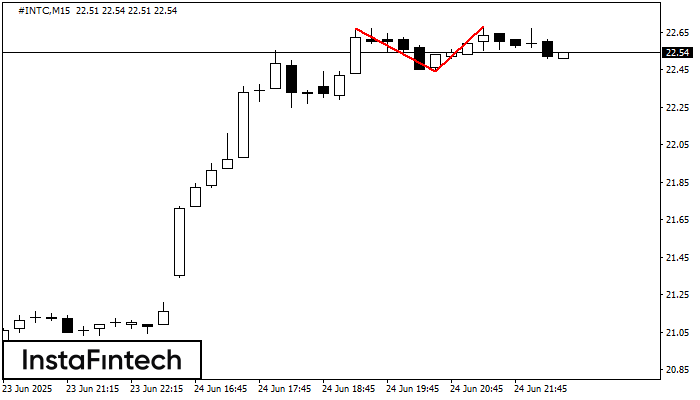
The Double Top reversal pattern has been formed on #INTC M15. Characteristics: the upper boundary 22.67; the lower boundary 22.44; the width of the pattern is 24 points. Sell trades
The M5 and M15 time frames may have more false entry points.
Open chart in a new window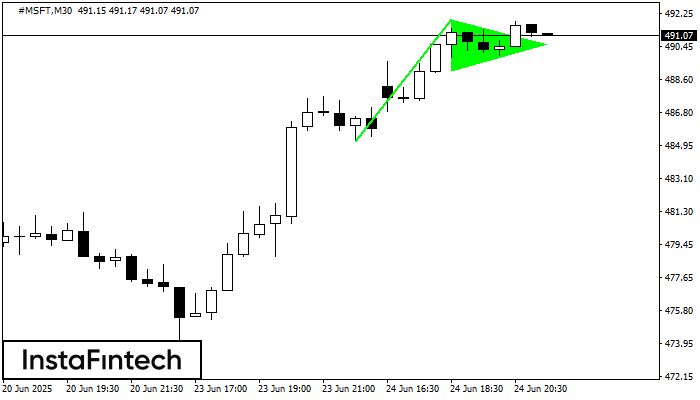
The Bullish pennant signal – Trading instrument #MSFT M30, continuation pattern. Forecast: it is possible to set up a buy position above the pattern’s high of 491.95, with the prospect
Open chart in a new window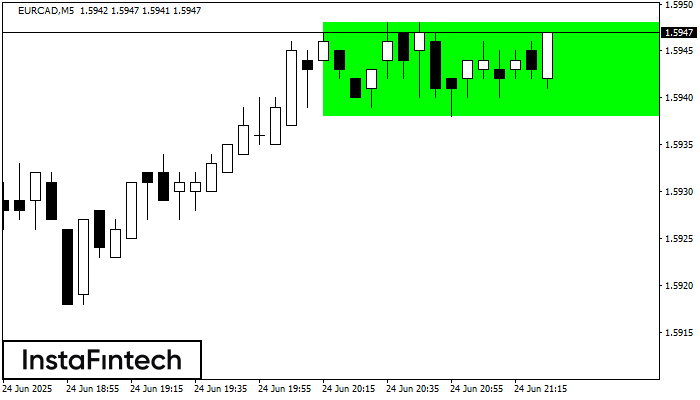
According to the chart of M5, EURCAD formed the Bullish Rectangle which is a pattern of a trend continuation. The pattern is contained within the following borders: the lower border
The M5 and M15 time frames may have more false entry points.
Open chart in a new window