


signal strength 2 of 5
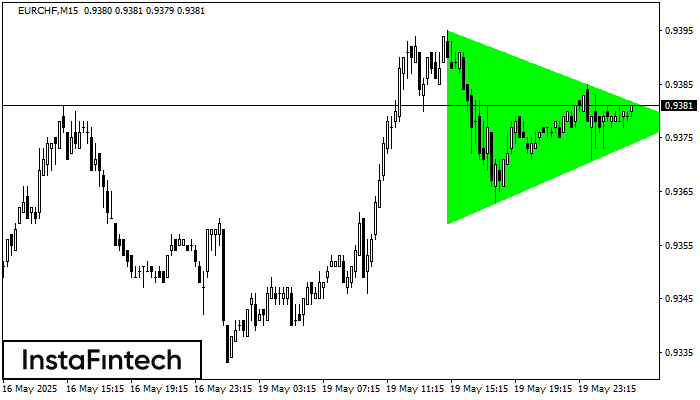
According to the chart of M15, EURCHF formed the Bullish Symmetrical Triangle pattern. Description: This is the pattern of a trend continuation. 0.9395 and 0.9359 are the coordinates of the upper and lower borders respectively. The pattern width is measured on the chart at 36 pips. Outlook: If the upper border 0.9395 is broken, the price is likely to continue its move by 0.9401.
The M5 and M15 time frames may have more false entry points.
See Also
- All
- Double Top
- Flag
- Head and Shoulders
- Pennant
- Rectangle
- Triangle
- Triple top
- All
- #AAPL
- #AMZN
- #Bitcoin
- #EBAY
- #FB
- #GOOG
- #INTC
- #KO
- #MA
- #MCD
- #MSFT
- #NTDOY
- #PEP
- #TSLA
- #TWTR
- AUDCAD
- AUDCHF
- AUDJPY
- AUDUSD
- EURCAD
- EURCHF
- EURGBP
- EURJPY
- EURNZD
- EURRUB
- EURUSD
- GBPAUD
- GBPCHF
- GBPJPY
- GBPUSD
- GOLD
- NZDCAD
- NZDCHF
- NZDJPY
- NZDUSD
- SILVER
- USDCAD
- USDCHF
- USDJPY
- USDRUB
- All
- M5
- M15
- M30
- H1
- D1
- All
- Buy
- Sale
- All
- 1
- 2
- 3
- 4
- 5
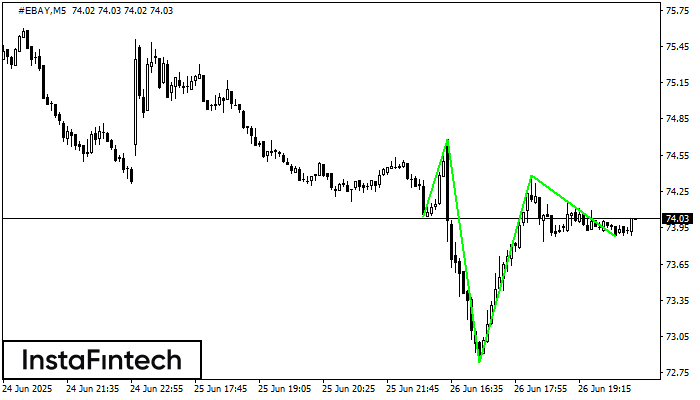
According to the chart of M5, #EBAY produced the pattern termed the Inverse Head and Shoulder. The Head is fixed at 72.84 while the median line of the Neck
The M5 and M15 time frames may have more false entry points.
Open chart in a new window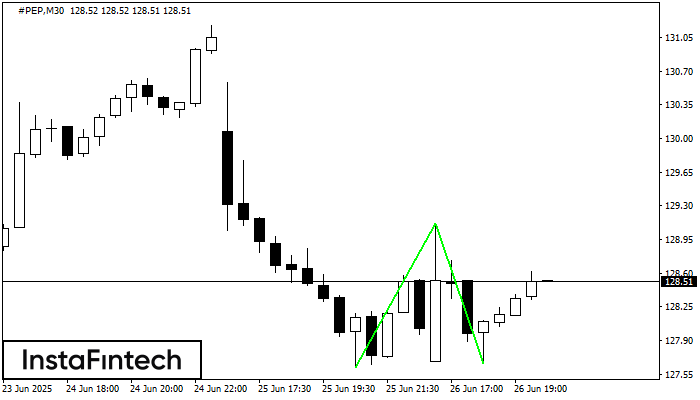
The Double Bottom pattern has been formed on #PEP M30. Characteristics: the support level 127.62; the resistance level 129.12; the width of the pattern 150 points. If the resistance level
Open chart in a new window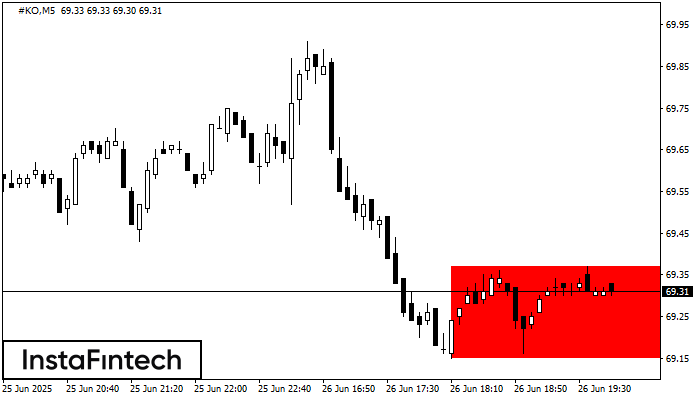
According to the chart of M5, #KO formed the Bearish Rectangle. The pattern indicates a trend continuation. The upper border is 69.37, the lower border is 69.15. The signal means
The M5 and M15 time frames may have more false entry points.
Open chart in a new window


