signal strength 1 of 5
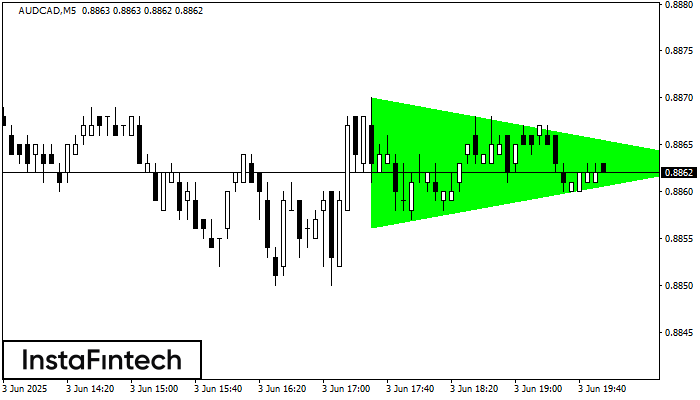
According to the chart of M5, AUDCAD formed the Bullish Symmetrical Triangle pattern. The lower border of the pattern touches the coordinates 0.8856/0.8863 whereas the upper border goes across 0.8870/0.8863. If the Bullish Symmetrical Triangle pattern is in progress, this evidently signals a further upward trend. In other words, in case the scenario comes true, the price of AUDCAD will breach the upper border to head for 0.8878.
The M5 and M15 time frames may have more false entry points.
See Also
- All
- Double Top
- Flag
- Head and Shoulders
- Pennant
- Rectangle
- Triangle
- Triple top
- All
- #AAPL
- #AMZN
- #Bitcoin
- #EBAY
- #FB
- #GOOG
- #INTC
- #KO
- #MA
- #MCD
- #MSFT
- #NTDOY
- #PEP
- #TSLA
- #TWTR
- AUDCAD
- AUDCHF
- AUDJPY
- AUDUSD
- EURCAD
- EURCHF
- EURGBP
- EURJPY
- EURNZD
- EURRUB
- EURUSD
- GBPAUD
- GBPCHF
- GBPJPY
- GBPUSD
- GOLD
- NZDCAD
- NZDCHF
- NZDJPY
- NZDUSD
- SILVER
- USDCAD
- USDCHF
- USDJPY
- USDRUB
- All
- M5
- M15
- M30
- H1
- D1
- All
- Buy
- Sale
- All
- 1
- 2
- 3
- 4
- 5
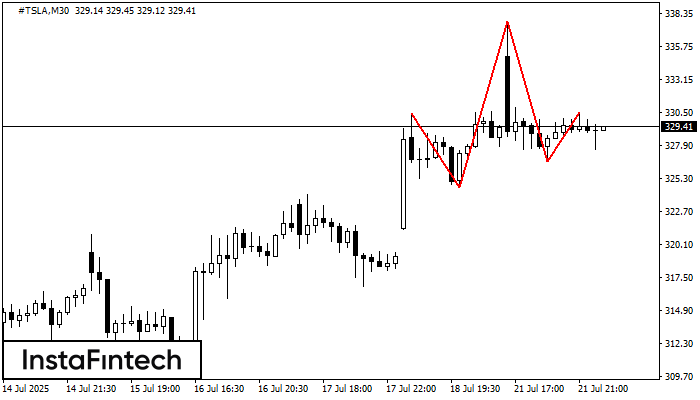
The #TSLA M30 formed the Head and Shoulders pattern with the following features: The Head’s top is at 337.71, the Neckline and the upward angle are at 324.60/326.66. The formation
Open chart in a new window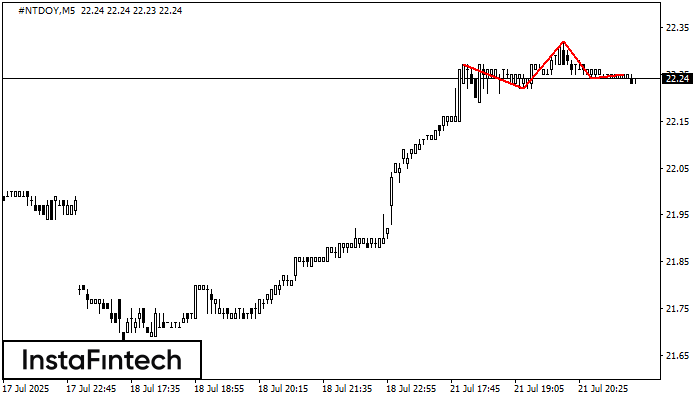
The technical pattern called Head and Shoulders has appeared on the chart of #NTDOY M5. There are weighty reasons to suggest that the price will surpass the Neckline 22.22/22.24 after
The M5 and M15 time frames may have more false entry points.
Open chart in a new window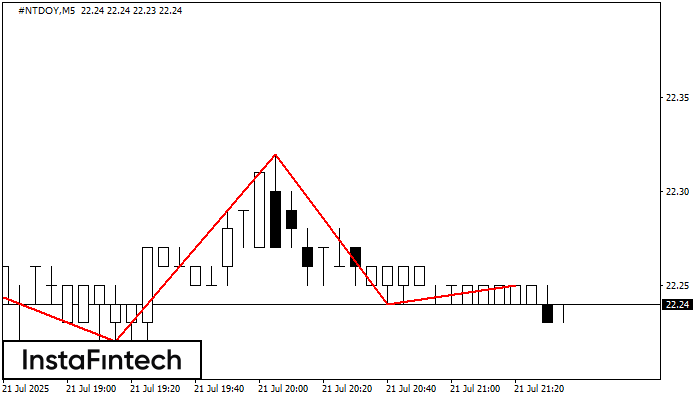
The #NTDOY M5 formed the Head and Shoulders pattern with the following features: The Head’s top is at 22.32, the Neckline and the upward angle are at 22.22/22.24. The formation
The M5 and M15 time frames may have more false entry points.
Open chart in a new window