signal strength 3 of 5
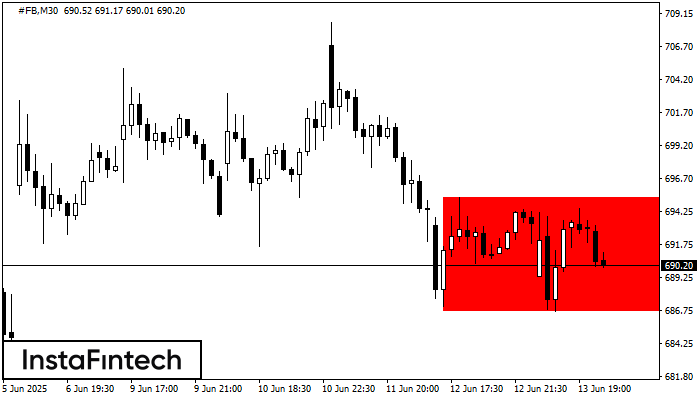
According to the chart of M30, #FB formed the Bearish Rectangle. This type of a pattern indicates a trend continuation. It consists of two levels: resistance 695.27 - 0.00 and support 686.69 – 686.69. In case the resistance level 686.69 - 686.69 is broken, the instrument is likely to follow the bearish trend.
See Also
- All
- Double Top
- Flag
- Head and Shoulders
- Pennant
- Rectangle
- Triangle
- Triple top
- All
- #AAPL
- #AMZN
- #Bitcoin
- #EBAY
- #FB
- #GOOG
- #INTC
- #KO
- #MA
- #MCD
- #MSFT
- #NTDOY
- #PEP
- #TSLA
- #TWTR
- AUDCAD
- AUDCHF
- AUDJPY
- AUDUSD
- EURCAD
- EURCHF
- EURGBP
- EURJPY
- EURNZD
- EURRUB
- EURUSD
- GBPAUD
- GBPCHF
- GBPJPY
- GBPUSD
- GOLD
- NZDCAD
- NZDCHF
- NZDJPY
- NZDUSD
- SILVER
- USDCAD
- USDCHF
- USDJPY
- USDRUB
- All
- M5
- M15
- M30
- H1
- D1
- All
- Buy
- Sale
- All
- 1
- 2
- 3
- 4
- 5
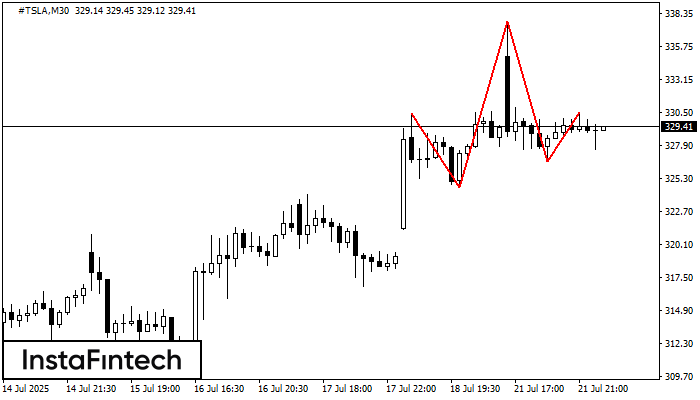
The #TSLA M30 formed the Head and Shoulders pattern with the following features: The Head’s top is at 337.71, the Neckline and the upward angle are at 324.60/326.66. The formation
Open chart in a new window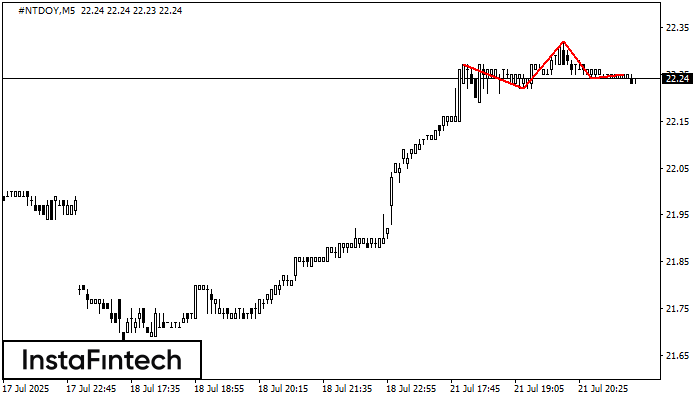
The technical pattern called Head and Shoulders has appeared on the chart of #NTDOY M5. There are weighty reasons to suggest that the price will surpass the Neckline 22.22/22.24 after
The M5 and M15 time frames may have more false entry points.
Open chart in a new window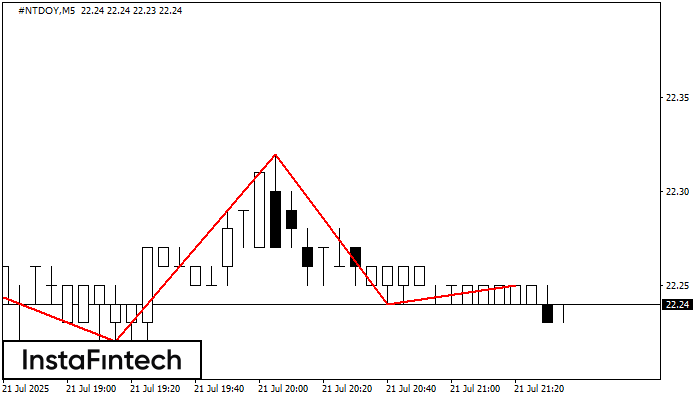
The #NTDOY M5 formed the Head and Shoulders pattern with the following features: The Head’s top is at 22.32, the Neckline and the upward angle are at 22.22/22.24. The formation
The M5 and M15 time frames may have more false entry points.
Open chart in a new window