


signal strength 2 of 5
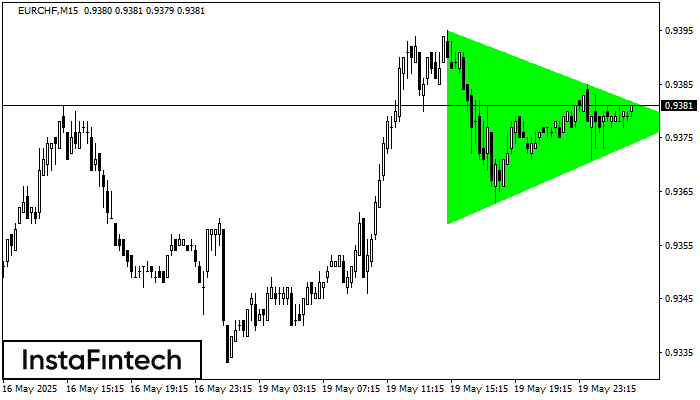
According to the chart of M15, EURCHF formed the Bullish Symmetrical Triangle pattern. Description: This is the pattern of a trend continuation. 0.9395 and 0.9359 are the coordinates of the upper and lower borders respectively. The pattern width is measured on the chart at 36 pips. Outlook: If the upper border 0.9395 is broken, the price is likely to continue its move by 0.9401.
The M5 and M15 time frames may have more false entry points.
- All
- Double Top
- Flag
- Head and Shoulders
- Pennant
- Rectangle
- Triangle
- Triple top
- All
- #AAPL
- #AMZN
- #Bitcoin
- #EBAY
- #FB
- #GOOG
- #INTC
- #KO
- #MA
- #MCD
- #MSFT
- #NTDOY
- #PEP
- #TSLA
- #TWTR
- AUDCAD
- AUDCHF
- AUDJPY
- AUDUSD
- EURCAD
- EURCHF
- EURGBP
- EURJPY
- EURNZD
- EURRUB
- EURUSD
- GBPAUD
- GBPCHF
- GBPJPY
- GBPUSD
- GOLD
- NZDCAD
- NZDCHF
- NZDJPY
- NZDUSD
- SILVER
- USDCAD
- USDCHF
- USDJPY
- USDRUB
- All
- M5
- M15
- M30
- H1
- D1
- All
- Buy
- Sale
- All
- 1
- 2
- 3
- 4
- 5
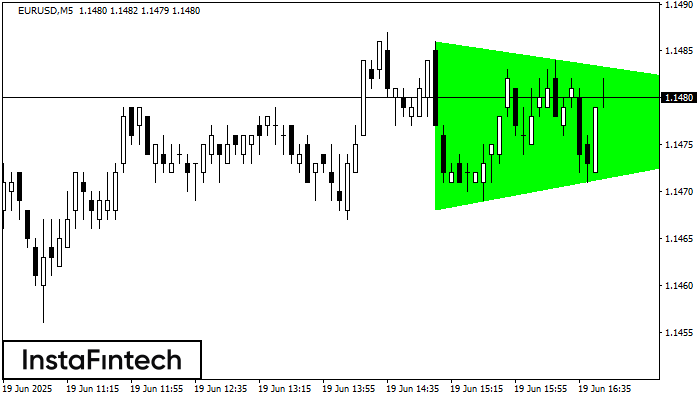
Según el gráfico de M5, EURUSD formó el patrón Triángulo Simétrico Alcista, que señala que la tendencia continuará. Descripción. El límite superior del patrón toca las coordenadas 1.1486/1.1478 donde
Los marcos de tiempo M5 y M15 pueden tener más puntos de entrada falsos.
Open chart in a new window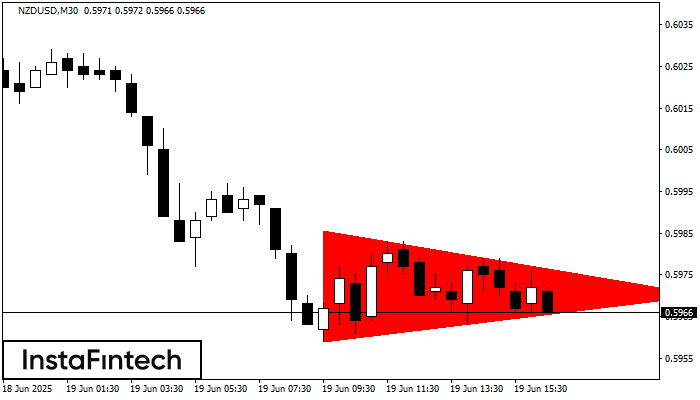
Según el gráfico de M30, el NZDUSD formó el patrón Triángulo Simétrico Bajista. Este patrón señala una tendencia bajista en caso de que el límite inferior 0.5959 sea roto. Aquí
Open chart in a new window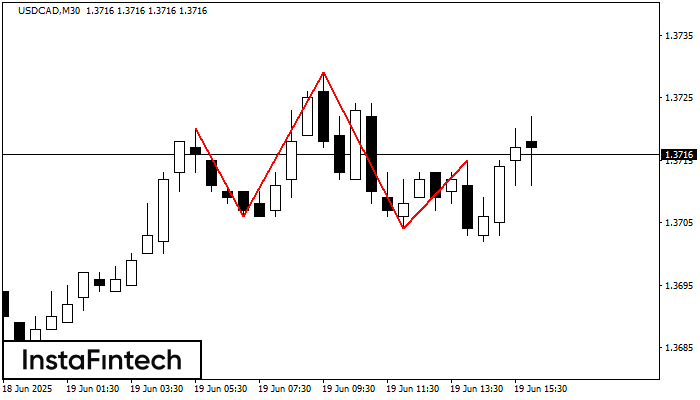
El USDCAD M30 formó el patrón Cabeza y Hombros con las siguientes características: El techo de la Cabeza se encuentra en 1.3729, la línea de cuello y el ángulo alcista
Open chart in a new window


