signal strength 3 of 5
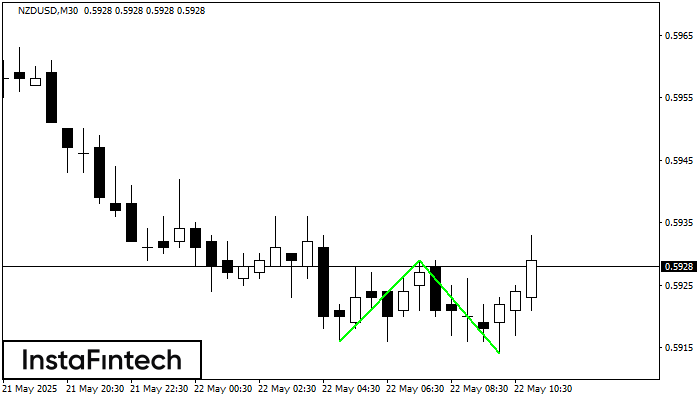
The Double Bottom pattern has been formed on NZDUSD M30. Characteristics: the support level 0.5916; the resistance level 0.5929; the width of the pattern 13 points. If the resistance level is broken, a change in the trend can be predicted with the first target point lying at the distance of 15 points.
See Also
- All
- Double Top
- Flag
- Head and Shoulders
- Pennant
- Rectangle
- Triangle
- Triple top
- All
- #AAPL
- #AMZN
- #Bitcoin
- #EBAY
- #FB
- #GOOG
- #INTC
- #KO
- #MA
- #MCD
- #MSFT
- #NTDOY
- #PEP
- #TSLA
- #TWTR
- AUDCAD
- AUDCHF
- AUDJPY
- AUDUSD
- EURCAD
- EURCHF
- EURGBP
- EURJPY
- EURNZD
- EURRUB
- EURUSD
- GBPAUD
- GBPCHF
- GBPJPY
- GBPUSD
- GOLD
- NZDCAD
- NZDCHF
- NZDJPY
- NZDUSD
- SILVER
- USDCAD
- USDCHF
- USDJPY
- USDRUB
- All
- M5
- M15
- M30
- H1
- D1
- All
- Buy
- Sale
- All
- 1
- 2
- 3
- 4
- 5
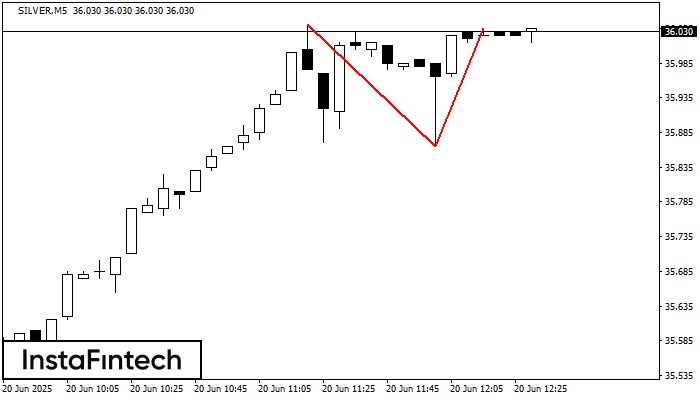
En el gráfico de SILVER M5 el patrón de reversión Doble Techo ha sido formado. Características: límite superior 36.03; límite inferior 35.87; el ancho del patrón 170 puntos. La señal
Los marcos de tiempo M5 y M15 pueden tener más puntos de entrada falsos.
Open chart in a new window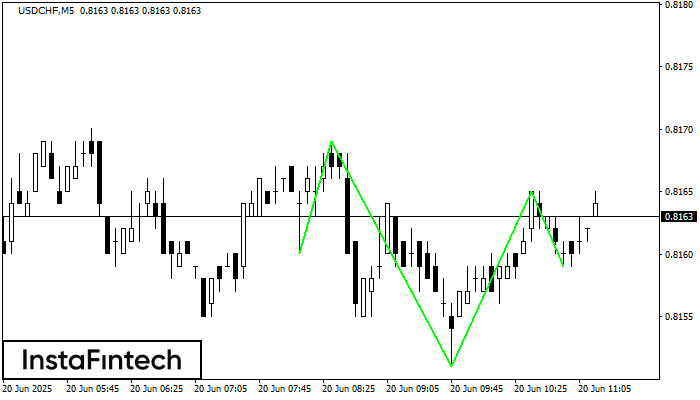
Según M5, USDCHF está formando el patrón técnico: el Cabeza y Hombros Inverso. En caso de que la línea de cuello 0.8169/0.8165 se rompa, es posible que el instrumento
Los marcos de tiempo M5 y M15 pueden tener más puntos de entrada falsos.
Open chart in a new window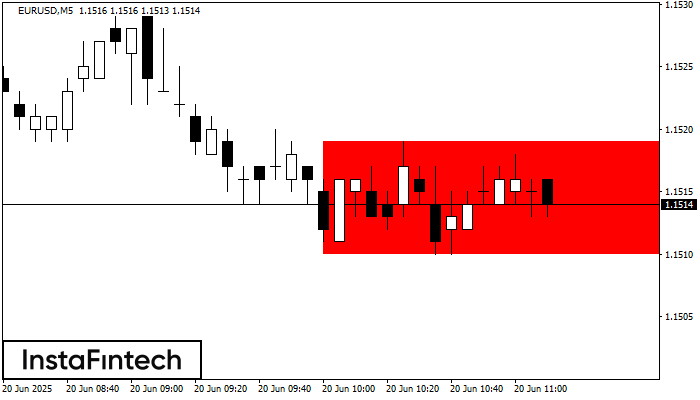
Según el gráfico de M5, EURUSD formó el Rectángulo Bajista. El patrón indica la continuación de una tendencia. El límite superior es 1.1519, el límite inferior es 1.1510. La señal
Los marcos de tiempo M5 y M15 pueden tener más puntos de entrada falsos.
Open chart in a new window