signal strength 3 of 5
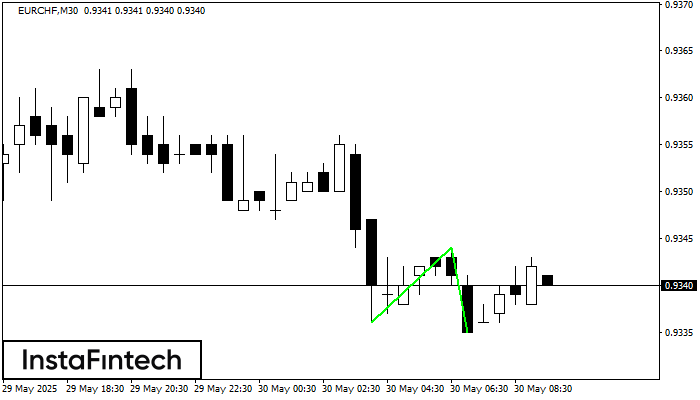
The Double Bottom pattern has been formed on EURCHF M30. This formation signals a reversal of the trend from downwards to upwards. The signal is that a buy trade should be opened after the upper boundary of the pattern 0.9344 is broken. The further movements will rely on the width of the current pattern 8 points.
- All
- Double Top
- Flag
- Head and Shoulders
- Pennant
- Rectangle
- Triangle
- Triple top
- All
- #AAPL
- #AMZN
- #Bitcoin
- #EBAY
- #FB
- #GOOG
- #INTC
- #KO
- #MA
- #MCD
- #MSFT
- #NTDOY
- #PEP
- #TSLA
- #TWTR
- AUDCAD
- AUDCHF
- AUDJPY
- AUDUSD
- EURCAD
- EURCHF
- EURGBP
- EURJPY
- EURNZD
- EURRUB
- EURUSD
- GBPAUD
- GBPCHF
- GBPJPY
- GBPUSD
- GOLD
- NZDCAD
- NZDCHF
- NZDJPY
- NZDUSD
- SILVER
- USDCAD
- USDCHF
- USDJPY
- USDRUB
- All
- M5
- M15
- M30
- H1
- D1
- All
- Buy
- Sale
- All
- 1
- 2
- 3
- 4
- 5
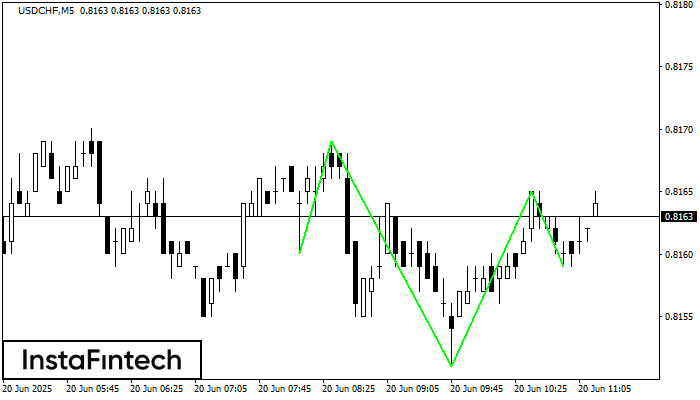
Según M5, USDCHF está formando el patrón técnico: el Cabeza y Hombros Inverso. En caso de que la línea de cuello 0.8169/0.8165 se rompa, es posible que el instrumento
Los marcos de tiempo M5 y M15 pueden tener más puntos de entrada falsos.
Open chart in a new window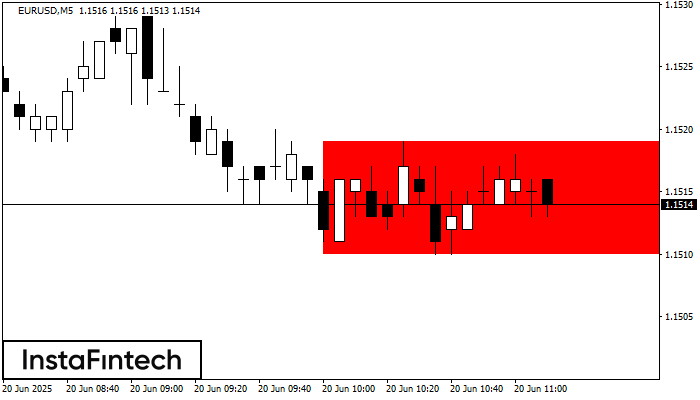
Según el gráfico de M5, EURUSD formó el Rectángulo Bajista. El patrón indica la continuación de una tendencia. El límite superior es 1.1519, el límite inferior es 1.1510. La señal
Los marcos de tiempo M5 y M15 pueden tener más puntos de entrada falsos.
Open chart in a new window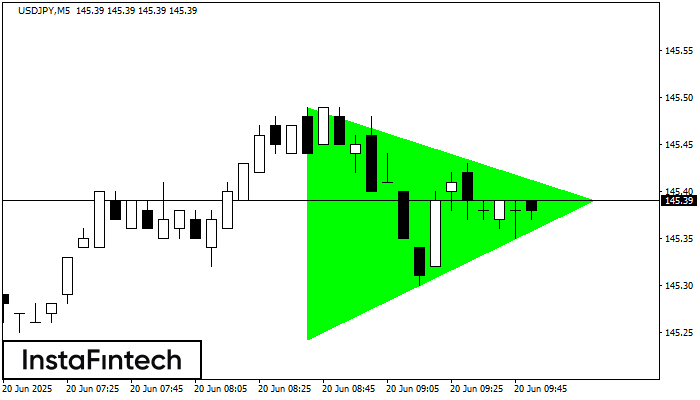
Según el gráfico de M5, el USDJPY formó el patrón Triángulo Simétrico Alcista. El límite inferior del patrón toca las coordenadas 145.24/145.39 donde el límite superior cruza 145.49/145.39
Los marcos de tiempo M5 y M15 pueden tener más puntos de entrada falsos.
Open chart in a new window