


signal strength 4 of 5
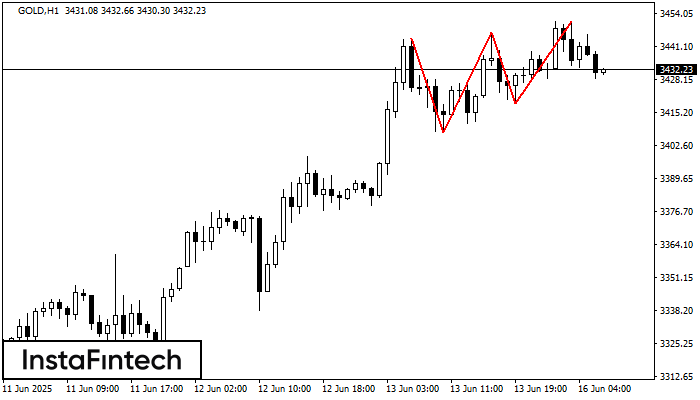
The Triple Top pattern has formed on the chart of the GOLD H1. Features of the pattern: borders have an ascending angle; the lower line of the pattern has the coordinates 3407.49/3418.72 with the upper limit 3443.98/3450.76; the projection of the width is 3649 points. The formation of the Triple Top figure most likely indicates a change in the trend from upward to downward. This means that in the event of a breakdown of the support level of 3407.49, the price is most likely to continue the downward movement.
See Also
- All
- Double Top
- Flag
- Head and Shoulders
- Pennant
- Rectangle
- Triangle
- Triple top
- All
- #AAPL
- #AMZN
- #Bitcoin
- #EBAY
- #FB
- #GOOG
- #INTC
- #KO
- #MA
- #MCD
- #MSFT
- #NTDOY
- #PEP
- #TSLA
- #TWTR
- AUDCAD
- AUDCHF
- AUDJPY
- AUDUSD
- EURCAD
- EURCHF
- EURGBP
- EURJPY
- EURNZD
- EURRUB
- EURUSD
- GBPAUD
- GBPCHF
- GBPJPY
- GBPUSD
- GOLD
- NZDCAD
- NZDCHF
- NZDJPY
- NZDUSD
- SILVER
- USDCAD
- USDCHF
- USDJPY
- USDRUB
- All
- M5
- M15
- M30
- H1
- D1
- All
- Buy
- Sale
- All
- 1
- 2
- 3
- 4
- 5
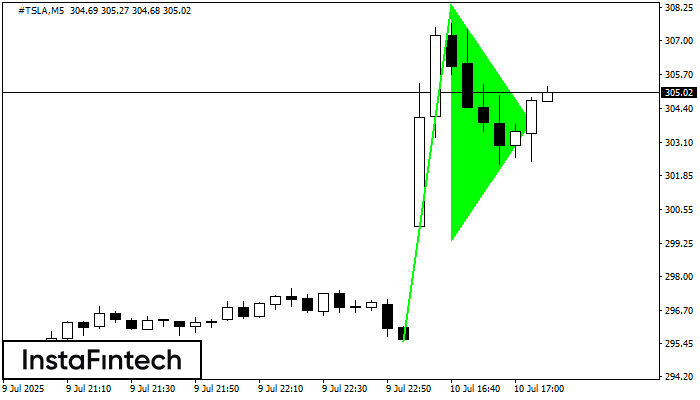
बुलिश पताका पैटर्न #TSLA M5 चार्ट पर बनता है। यह एक प्रकार का निरंतरता पैटर्न है। अगर कीमत पेनेन्ट के उच्च स्तर 308.39 से ऊपर फिक्स होती है तो
M5 और M15 समय सीमा में अधिक फाल्स एंट्री पॉइंट्स हो सकते हैं।
Open chart in a new window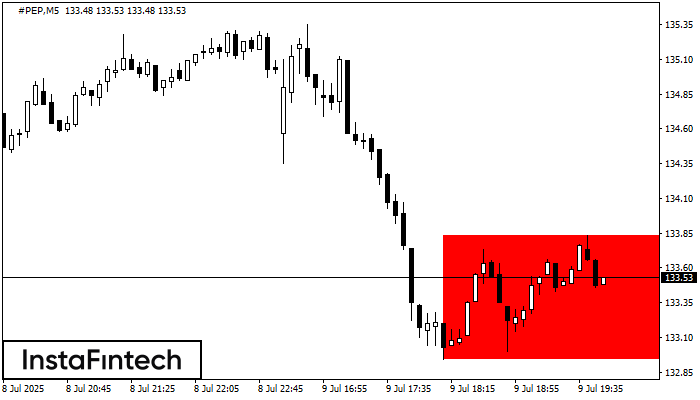
M5 के चार्ट के अनुसार, #PEP से बियरिश आयत बना। इस प्रकार का पैटर्न एक प्रवृत्ति निरंतरता को इंगित करता है। इसमें दो स्तर होते हैं: प्रतिरोध 133.83 - 0.00
M5 और M15 समय सीमा में अधिक फाल्स एंट्री पॉइंट्स हो सकते हैं।
Open chart in a new window
M5 के चार्ट के अनुसार, #PEP से बियरिश आयत बना। पैटर्न प्रवृत्ति निरंतरता को इंगित करता है। ऊपरी सीमा 133.83 है, निचली सीमा 132.94 है। सिग्नल का मतलब है कि
M5 और M15 समय सीमा में अधिक फाल्स एंट्री पॉइंट्स हो सकते हैं।
Open chart in a new window


