

signal strength 1 of 5
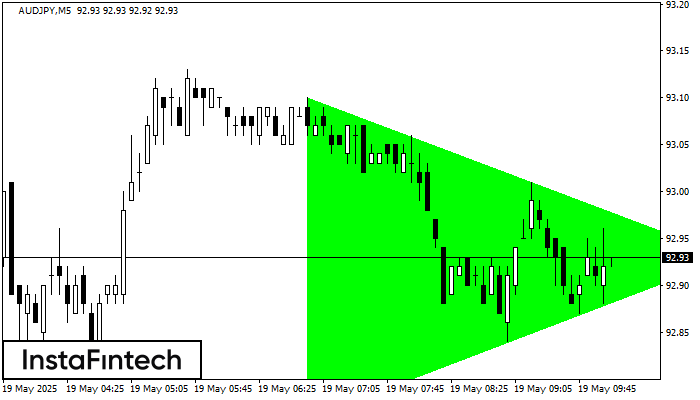
According to the chart of M5, AUDJPY formed the Bullish Symmetrical Triangle pattern, which signals the trend will continue. Description. The upper border of the pattern touches the coordinates 93.10/92.93 whereas the lower border goes across 92.76/92.93. The pattern width is measured on the chart at 34 pips. If the Bullish Symmetrical Triangle pattern is in progress during the upward trend, this indicates the current trend will go on. In case 92.93 is broken, the price could continue its move toward 93.08.
The M5 and M15 time frames may have more false entry points.
See Also
- All
- Double Top
- Flag
- Head and Shoulders
- Pennant
- Rectangle
- Triangle
- Triple top
- All
- #AAPL
- #AMZN
- #Bitcoin
- #EBAY
- #FB
- #GOOG
- #INTC
- #KO
- #MA
- #MCD
- #MSFT
- #NTDOY
- #PEP
- #TSLA
- #TWTR
- AUDCAD
- AUDCHF
- AUDJPY
- AUDUSD
- EURCAD
- EURCHF
- EURGBP
- EURJPY
- EURNZD
- EURRUB
- EURUSD
- GBPAUD
- GBPCHF
- GBPJPY
- GBPUSD
- GOLD
- NZDCAD
- NZDCHF
- NZDJPY
- NZDUSD
- SILVER
- USDCAD
- USDCHF
- USDJPY
- USDRUB
- All
- M5
- M15
- M30
- H1
- D1
- All
- Buy
- Sale
- All
- 1
- 2
- 3
- 4
- 5
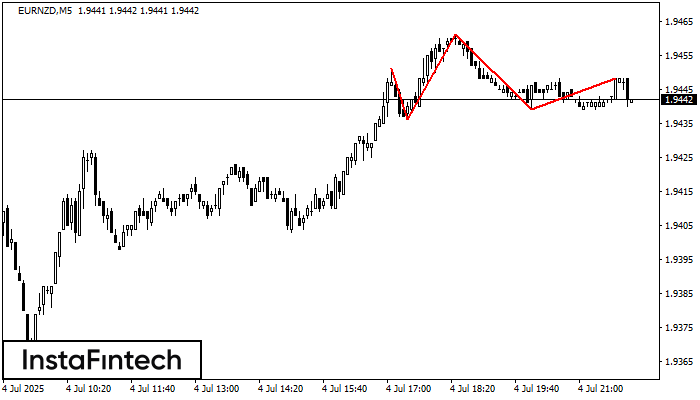
Berdasarkan M5, EURNZD membentuk corak Head dan Shoulders. Bahagian atas Head ditetapkan pada 1.9461 manakala garisan median Neck akan ditetapkan pada 1.9436/1.9439. Pembentukan corak Head dan Shoulders jelas menandakan pembalikan
Carta masa M5 dan M15 mungkin mempunyai lebih banyak titik kemasukan palsu.
Open chart in a new window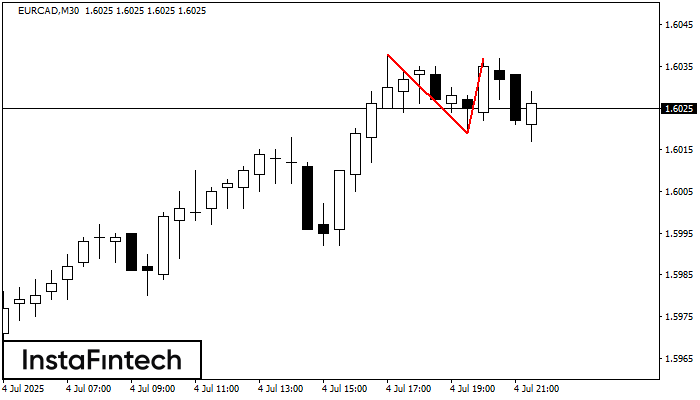
Corak Double Top telah dibentuk pada EURCAD M30. Isyarat bahawa aliran telah berubah dari aliran menaik ke aliran menurun. Mungkin, sekiranya asas corak 1.6019 ditembusi, pergerakan menurun akan berterusan
Open chart in a new window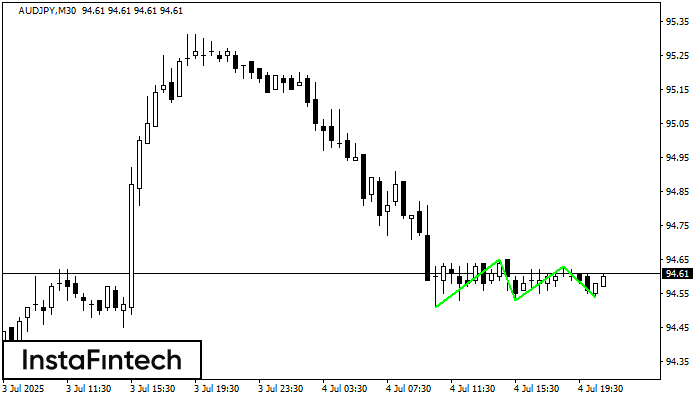
Corak Triple Bottom telah dibentuk pada carta AUDJPY M30. Ciri-ciri corak: Garisan bawah corak mempunyai koordinat 94.65 dengan had atas 94.65/94.63, unjuran lebar adalah 14 mata. Pembentukan corak Triple Bottom
Open chart in a new window


